33
/
AIzaSyB4mHJ5NPEv-XzF7P6NDYXjlkCWaeKw5bc
November 30, 2025
25027
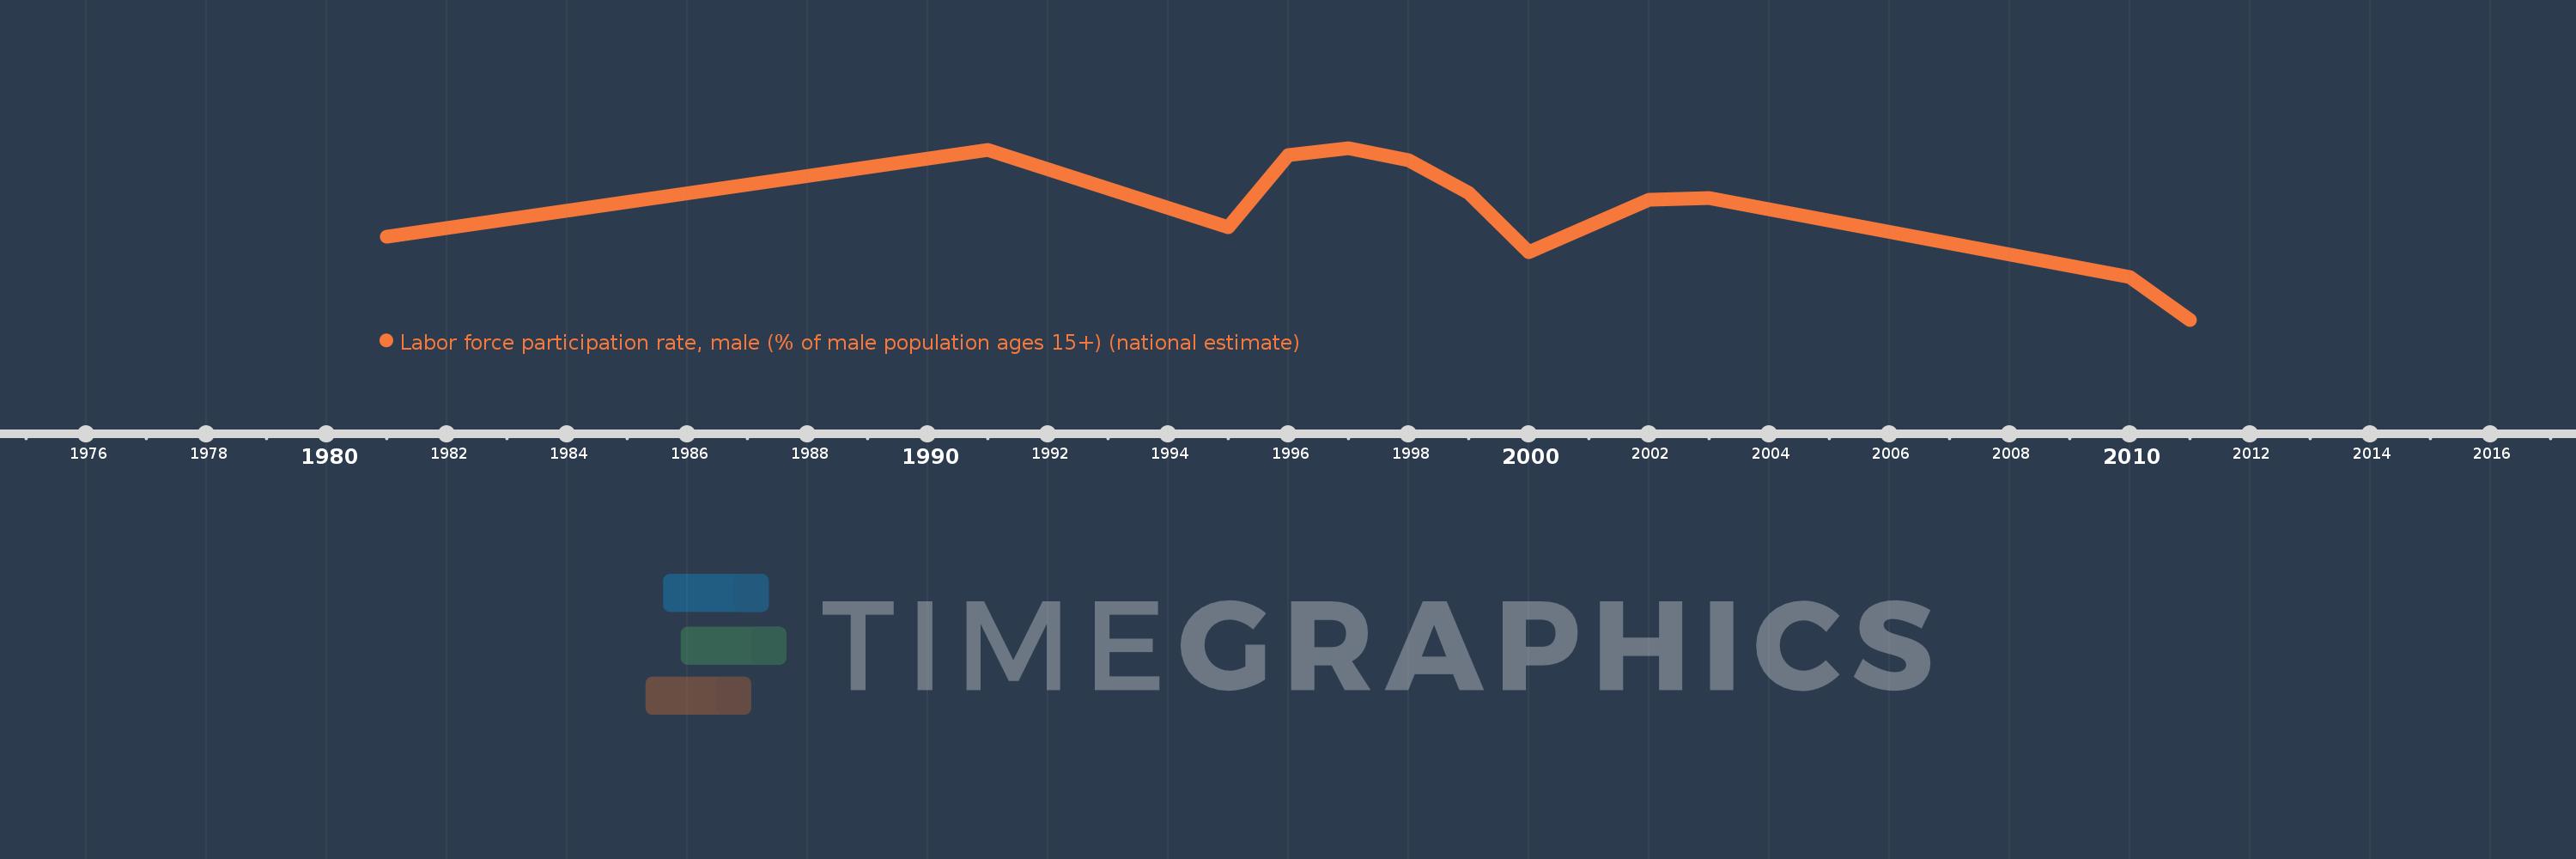
Caribbean small states
CSS
false
2
1
Labor force participation rate, male (% of male population ages 15+) (national estimate)
2011,2010,2003,2002,2000,1999,1998,1997,1996,1995,1991,1981