33
/
AIzaSyB4mHJ5NPEv-XzF7P6NDYXjlkCWaeKw5bc
November 30, 2025
283424
West Bank and Gaza
PSE
true
2
1
Changes in inventories (constant LCU)
2016,2015,2014,2013,2012,2011,2010,2009,2008,2007,2006,2005,2004,2003,2002,2001,2000,1999,1998,1997,1996,1995
Create a timeline
Public Timelines
For education
For educational institutions
For teachers
For students
Cabinet
For educational institutions
For teachers
For students
Open cabinet
FAQ
Close
Create a timeline
Public timelines
FAQ
About & Feedback
Terms
Privacy
FAQ
Support 24/7
Cabinet
Get premium
Donate
Download
Global statistics library
→
West Bank and Gaza
→
Changes in inventories (constant LCU)
This statistics in other country:
Albania
Algeria
Angola
Argentina
Armenia
Australia
Austria
Azerbaijan
Bahamas, The
Bahrain
Barbados
Belarus
Belgium
Belize
Benin
Bhutan
Bolivia
Bosnia and Herzegovina
Botswana
Brazil
Brunei Darussalam
Burkina Faso
Burundi
Cabo Verde
Cambodia
Cameroon
Canada
Central African Republic
Chad
Chile
China
Colombia
Comoros
Congo, Dem. Rep.
Congo, Rep.
Cote d'Ivoire
Croatia
Cuba
Cyprus
Czech Republic
Denmark
Djibouti
Dominican Republic
Ecuador
Egypt, Arab Rep.
El Salvador
Equatorial Guinea
Eritrea
Estonia
Finland
France
Gabon
Gambia, The
Georgia
Germany
Ghana
Greece
Guatemala
Guinea
Guinea-Bissau
Honduras
Hong Kong SAR, China
Hungary
Iceland
India
Indonesia
Iran, Islamic Rep.
Ireland
Italy
Jamaica
Japan
Jordan
Kazakhstan
Kenya
Korea, Rep.
Kosovo
Kyrgyz Republic
Lao PDR
Latvia
Lebanon
Liberia
Lithuania
Luxembourg
Macao SAR, China
Macedonia, FYR
Madagascar
Malawi
Malaysia
Maldives
Mali
Mauritania
Mauritius
Mexico
Moldova
Mongolia
Montenegro
Morocco
Mozambique
Namibia
Nepal
Netherlands
New Zealand
Nicaragua
Niger
Nigeria
Norway
Oman
Pakistan
Panama
Papua New Guinea
Paraguay
Peru
Philippines
Poland
Portugal
Puerto Rico
Romania
Russian Federation
Rwanda
Saudi Arabia
Senegal
Serbia
Seychelles
Sierra Leone
Singapore
Slovak Republic
Slovenia
Somalia
South Africa
South Sudan
Spain
Sri Lanka
Sudan
Swaziland
Sweden
Switzerland
Syrian Arab Republic
Tajikistan
Tanzania
Thailand
Timor-Leste
Togo
Trinidad and Tobago
Tunisia
Turkey
Uganda
Ukraine
United Arab Emirates
United Kingdom
United States
Uruguay
Vanuatu
Venezuela, RB
Vietnam
West Bank and Gaza
Zambia
Zimbabwe
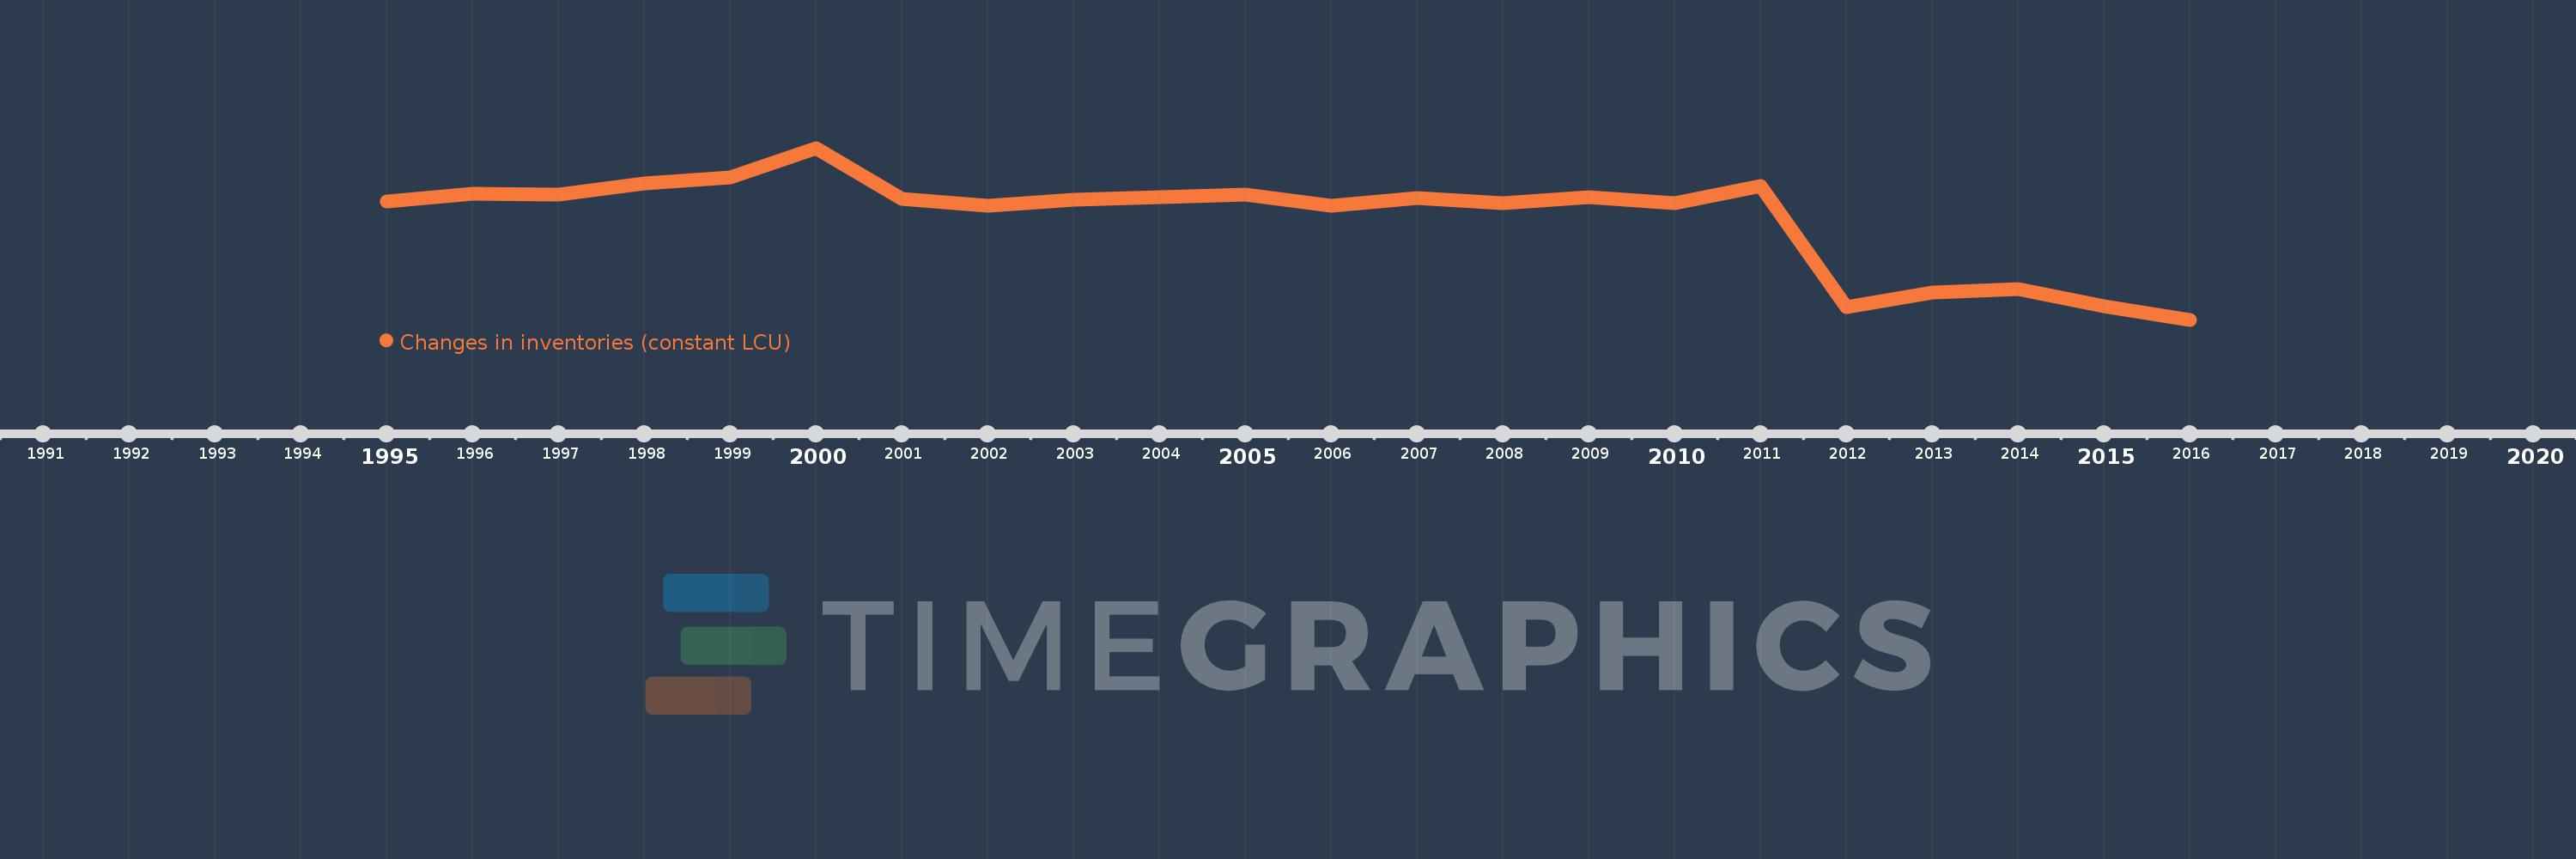
Timeline:
This timeline shows a graph from
1995
to
2016
of West Bank and Gaza. No data until
1994
. Number of actual observations by date:
22
.
Source name:
World Development Indicators
Source organization:
World Bank national accounts data, and OECD National Accounts data files.
Categories, topics:
Economy & Growth
Last updated:
apr 23, 2017
Indicators value changes by year
Meaning:
-28.751 mln
Minimum:
-930.889 mln
jan 1, 2016
Maximum:
596.117 mln
jan 1, 2000
At the date of observation
Value
Absolute change
Change from the previous value
jan 1, 1995
123.455 mln
+123.455 mln
0.0%
jan 1, 1996
190.615 mln
+67.16 mln
54.4%
jan 1, 1997
183.842 mln
-6.773 mln
-3.55%
jan 1, 1998
281.151 mln
+97.309 mln
52.93%
jan 1, 1999
337.449 mln
+56.298 mln
20.02%
jan 1, 2000
596.117 mln
+258.668 mln
76.65%
jan 1, 2001
143.929 mln
-452.188 mln
-75.86%
jan 1, 2002
82.852 mln
-61.076 mln
-42.44%
jan 1, 2003
133.132 mln
+50.28 mln
60.69%
jan 1, 2004
156.065 mln
+22.933 mln
17.23%
jan 1, 2005
178.832 mln
+22.767 mln
14.59%
jan 1, 2006
79.881 mln
-98.951 mln
-55.33%
jan 1, 2007
150.161 mln
+70.279 mln
87.98%
jan 1, 2008
106.811 mln
-43.35 mln
-28.87%
jan 1, 2009
160.716 mln
+53.905 mln
50.47%
jan 1, 2010
105.986 mln
-54.73 mln
-34.05%
jan 1, 2011
258.489 mln
+152.503 mln
143.89%
jan 1, 2012
-815.807 mln
-1.074 bln
-415.61%
jan 1, 2013
-685.579 mln
+130.228 mln
-15.96%
jan 1, 2014
-659.332 mln
+26.247 mln
-3.83%
jan 1, 2015
-810.394 mln
-151.062 mln
22.91%
jan 1, 2016
-930.889 mln
-120.494 mln
14.87%
Ranking of countries by current statistics by years
About & Feedback
Terms
Privacy
FAQ
Support 24/7
Cabinet
Get premium
Donate
The service accepts bank transfer (ACH, Wire) or cards (Visa, MasterCard, etc). Processed by Stripe.
Secured with SSL