33
/
AIzaSyB4mHJ5NPEv-XzF7P6NDYXjlkCWaeKw5bc
November 30, 2025
116674
Cyprus
CYP
true
2
1
Changes in inventories (constant LCU)
1995,1994,1993,1992,1991,1990,1989,1988,1987,1986,1985,1984,1983,1982,1981,1980,1979,1978,1977,1976
Create a timeline
Public Timelines
For education
For educational institutions
For teachers
For students
Cabinet
For educational institutions
For teachers
For students
Open cabinet
FAQ
Close
Create a timeline
Public timelines
FAQ
About & Feedback
Terms
Privacy
FAQ
Support 24/7
Cabinet
Get premium
Donate
Download
Global statistics library
→
Cyprus
→
Changes in inventories (constant LCU)
This statistics in other country:
Albania
Algeria
Angola
Argentina
Armenia
Australia
Austria
Azerbaijan
Bahamas, The
Bahrain
Barbados
Belarus
Belgium
Belize
Benin
Bhutan
Bolivia
Bosnia and Herzegovina
Botswana
Brazil
Brunei Darussalam
Burkina Faso
Burundi
Cabo Verde
Cambodia
Cameroon
Canada
Central African Republic
Chad
Chile
China
Colombia
Comoros
Congo, Dem. Rep.
Congo, Rep.
Cote d'Ivoire
Croatia
Cuba
Cyprus
Czech Republic
Denmark
Djibouti
Dominican Republic
Ecuador
Egypt, Arab Rep.
El Salvador
Equatorial Guinea
Eritrea
Estonia
Finland
France
Gabon
Gambia, The
Georgia
Germany
Ghana
Greece
Guatemala
Guinea
Guinea-Bissau
Honduras
Hong Kong SAR, China
Hungary
Iceland
India
Indonesia
Iran, Islamic Rep.
Ireland
Italy
Jamaica
Japan
Jordan
Kazakhstan
Kenya
Korea, Rep.
Kosovo
Kyrgyz Republic
Lao PDR
Latvia
Lebanon
Liberia
Lithuania
Luxembourg
Macao SAR, China
Macedonia, FYR
Madagascar
Malawi
Malaysia
Maldives
Mali
Mauritania
Mauritius
Mexico
Moldova
Mongolia
Montenegro
Morocco
Mozambique
Namibia
Nepal
Netherlands
New Zealand
Nicaragua
Niger
Nigeria
Norway
Oman
Pakistan
Panama
Papua New Guinea
Paraguay
Peru
Philippines
Poland
Portugal
Puerto Rico
Romania
Russian Federation
Rwanda
Saudi Arabia
Senegal
Serbia
Seychelles
Sierra Leone
Singapore
Slovak Republic
Slovenia
Somalia
South Africa
South Sudan
Spain
Sri Lanka
Sudan
Swaziland
Sweden
Switzerland
Syrian Arab Republic
Tajikistan
Tanzania
Thailand
Timor-Leste
Togo
Trinidad and Tobago
Tunisia
Turkey
Uganda
Ukraine
United Arab Emirates
United Kingdom
United States
Uruguay
Vanuatu
Venezuela, RB
Vietnam
West Bank and Gaza
Zambia
Zimbabwe
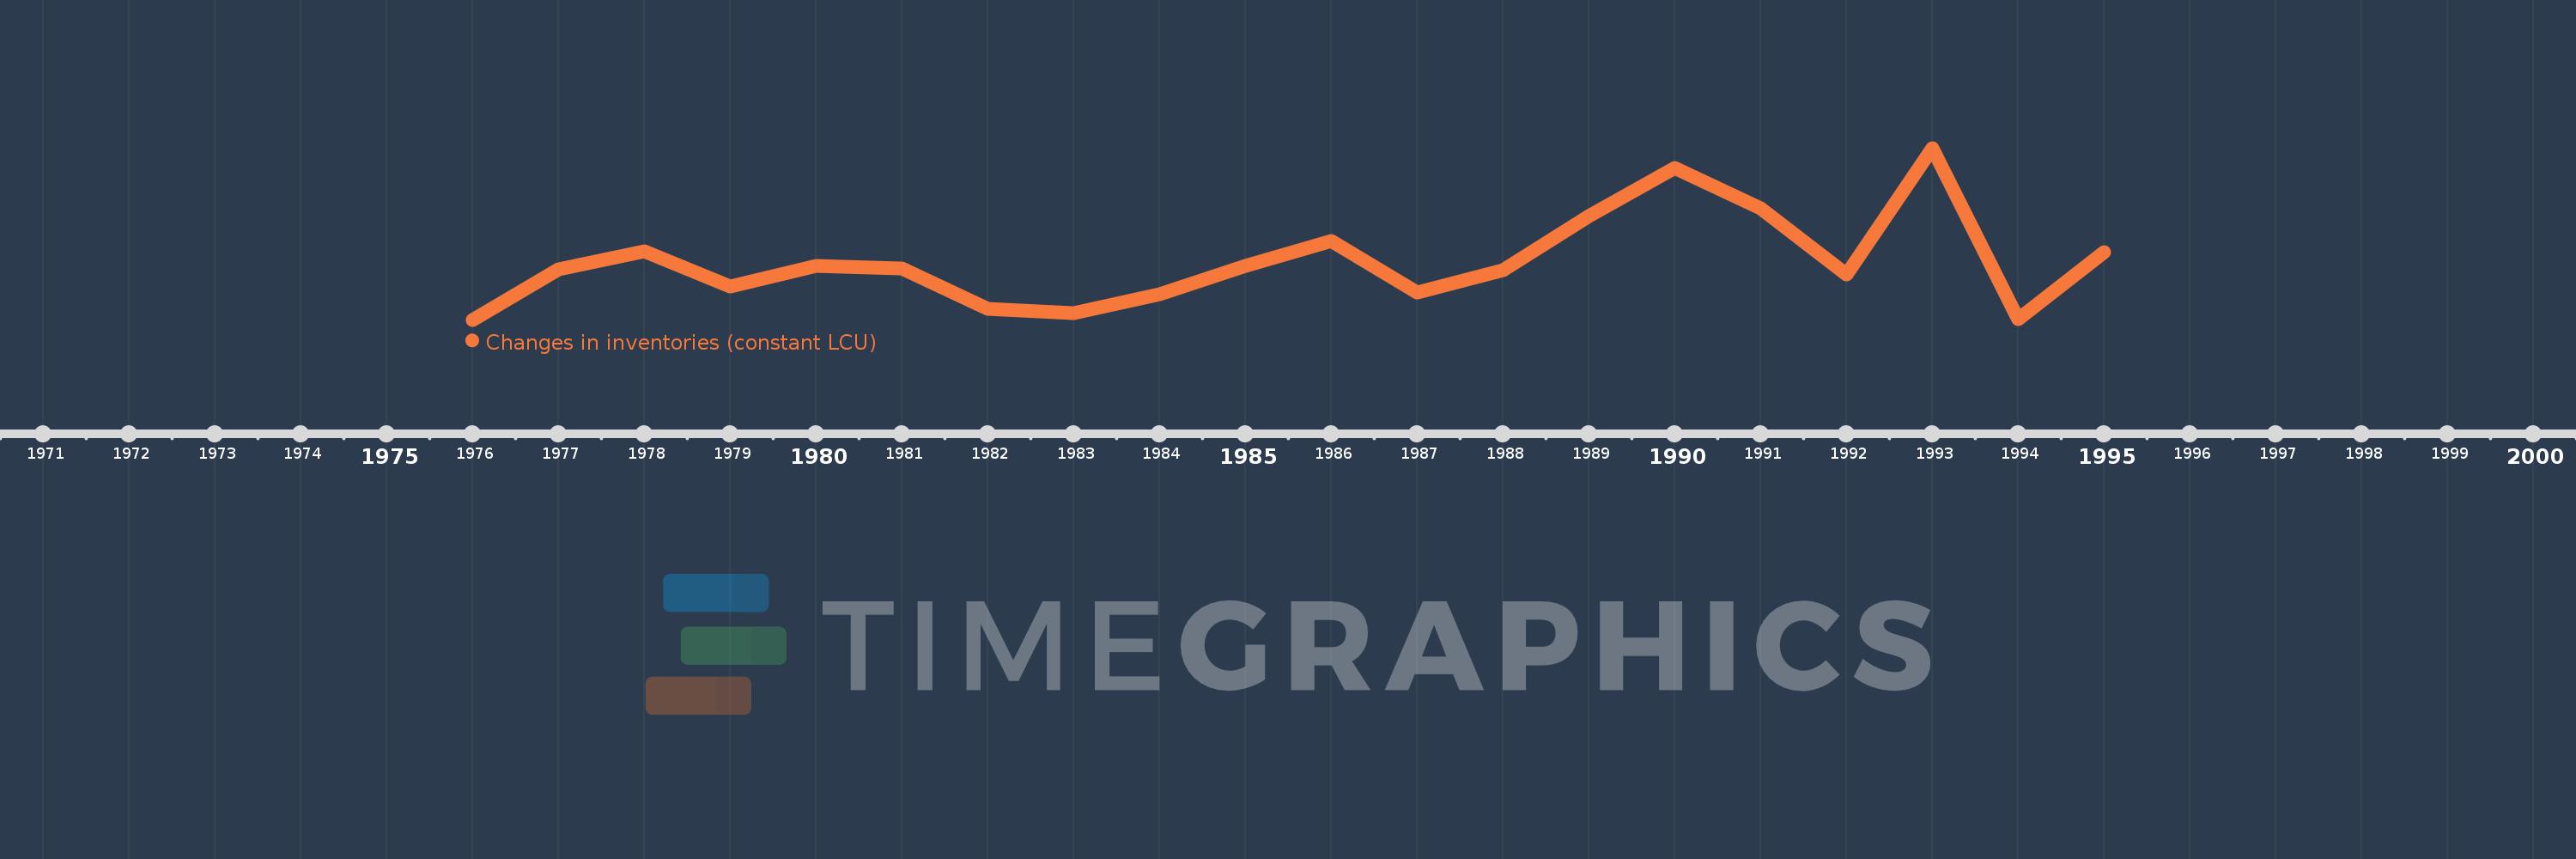
Timeline:
This timeline shows a graph from
1976
to
1995
of Cyprus. No data until
1975
. Number of actual observations by date:
20
.
Source name:
World Development Indicators
Source organization:
World Bank national accounts data, and OECD National Accounts data files.
Categories, topics:
Economy & Growth
Last updated:
apr 23, 2017
Indicators value changes by year
Meaning:
405.817 mln
Minimum:
215.478 mln
jan 1, 1976
Maximum:
778.958 mln
jan 1, 1993
At the date of observation
Value
Absolute change
Change from the previous value
jan 1, 1976
215.478 mln
+215.478 mln
0.0%
jan 1, 1977
381.386 mln
+165.908 mln
77.0%
jan 1, 1978
440.061 mln
+58.675 mln
15.38%
jan 1, 1979
325.746 mln
-114.314 mln
-25.98%
jan 1, 1980
392.514 mln
+66.768 mln
20.5%
jan 1, 1981
383.409 mln
-9.105 mln
-2.32%
jan 1, 1982
249.874 mln
-133.536 mln
-34.83%
jan 1, 1983
236.722 mln
-13.151 mln
-5.26%
jan 1, 1984
298.432 mln
+61.71 mln
26.07%
jan 1, 1985
392.514 mln
+94.082 mln
31.53%
jan 1, 1986
472.433 mln
+79.919 mln
20.36%
jan 1, 1987
303.49 mln
-168.943 mln
-35.76%
jan 1, 1988
378.351 mln
+74.861 mln
24.67%
jan 1, 1989
554.375 mln
+176.024 mln
46.52%
jan 1, 1990
714.213 mln
+159.838 mln
28.83%
jan 1, 1991
579.666 mln
-134.547 mln
-18.84%
jan 1, 1992
365.2 mln
-214.466 mln
-37.0%
jan 1, 1993
778.958 mln
+413.758 mln
113.3%
jan 1, 1994
216.49 mln
-562.468 mln
-72.21%
jan 1, 1995
437.026 mln
+220.536 mln
101.87%
Ranking of countries by current statistics by years
About & Feedback
Terms
Privacy
FAQ
Support 24/7
Cabinet
Get premium
Donate
The service accepts bank transfer (ACH, Wire) or cards (Visa, MasterCard, etc). Processed by Stripe.
Secured with SSL