33
/
AIzaSyB4mHJ5NPEv-XzF7P6NDYXjlkCWaeKw5bc
November 30, 2025
281797
Venezuela, RB
VEN
true
2
1
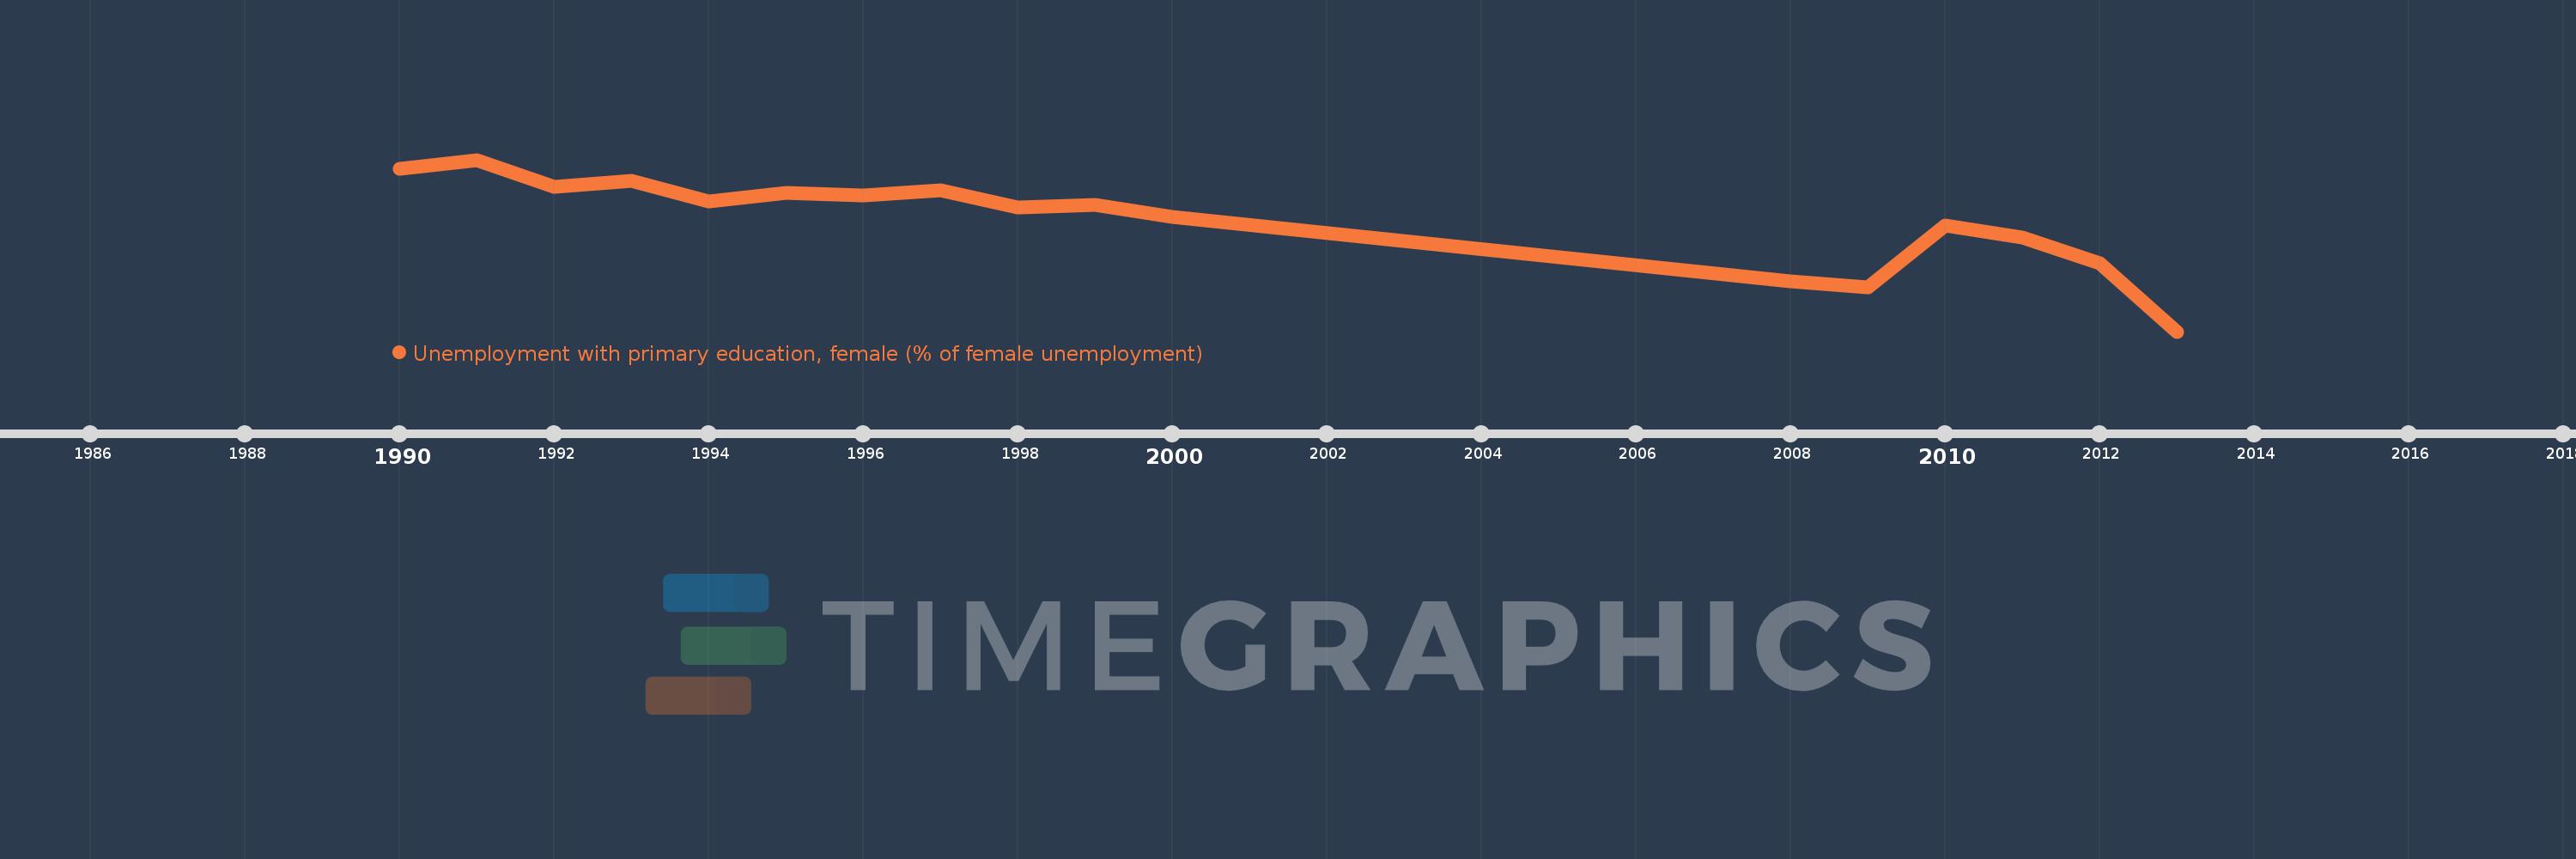
Unemployment with primary education, female (% of female unemployment)
2013,2012,2011,2010,2009,2008,2000,1999,1998,1997,1996,1995,1994,1993,1992,1991,1990