Download This statistics in other country:
Timeline:
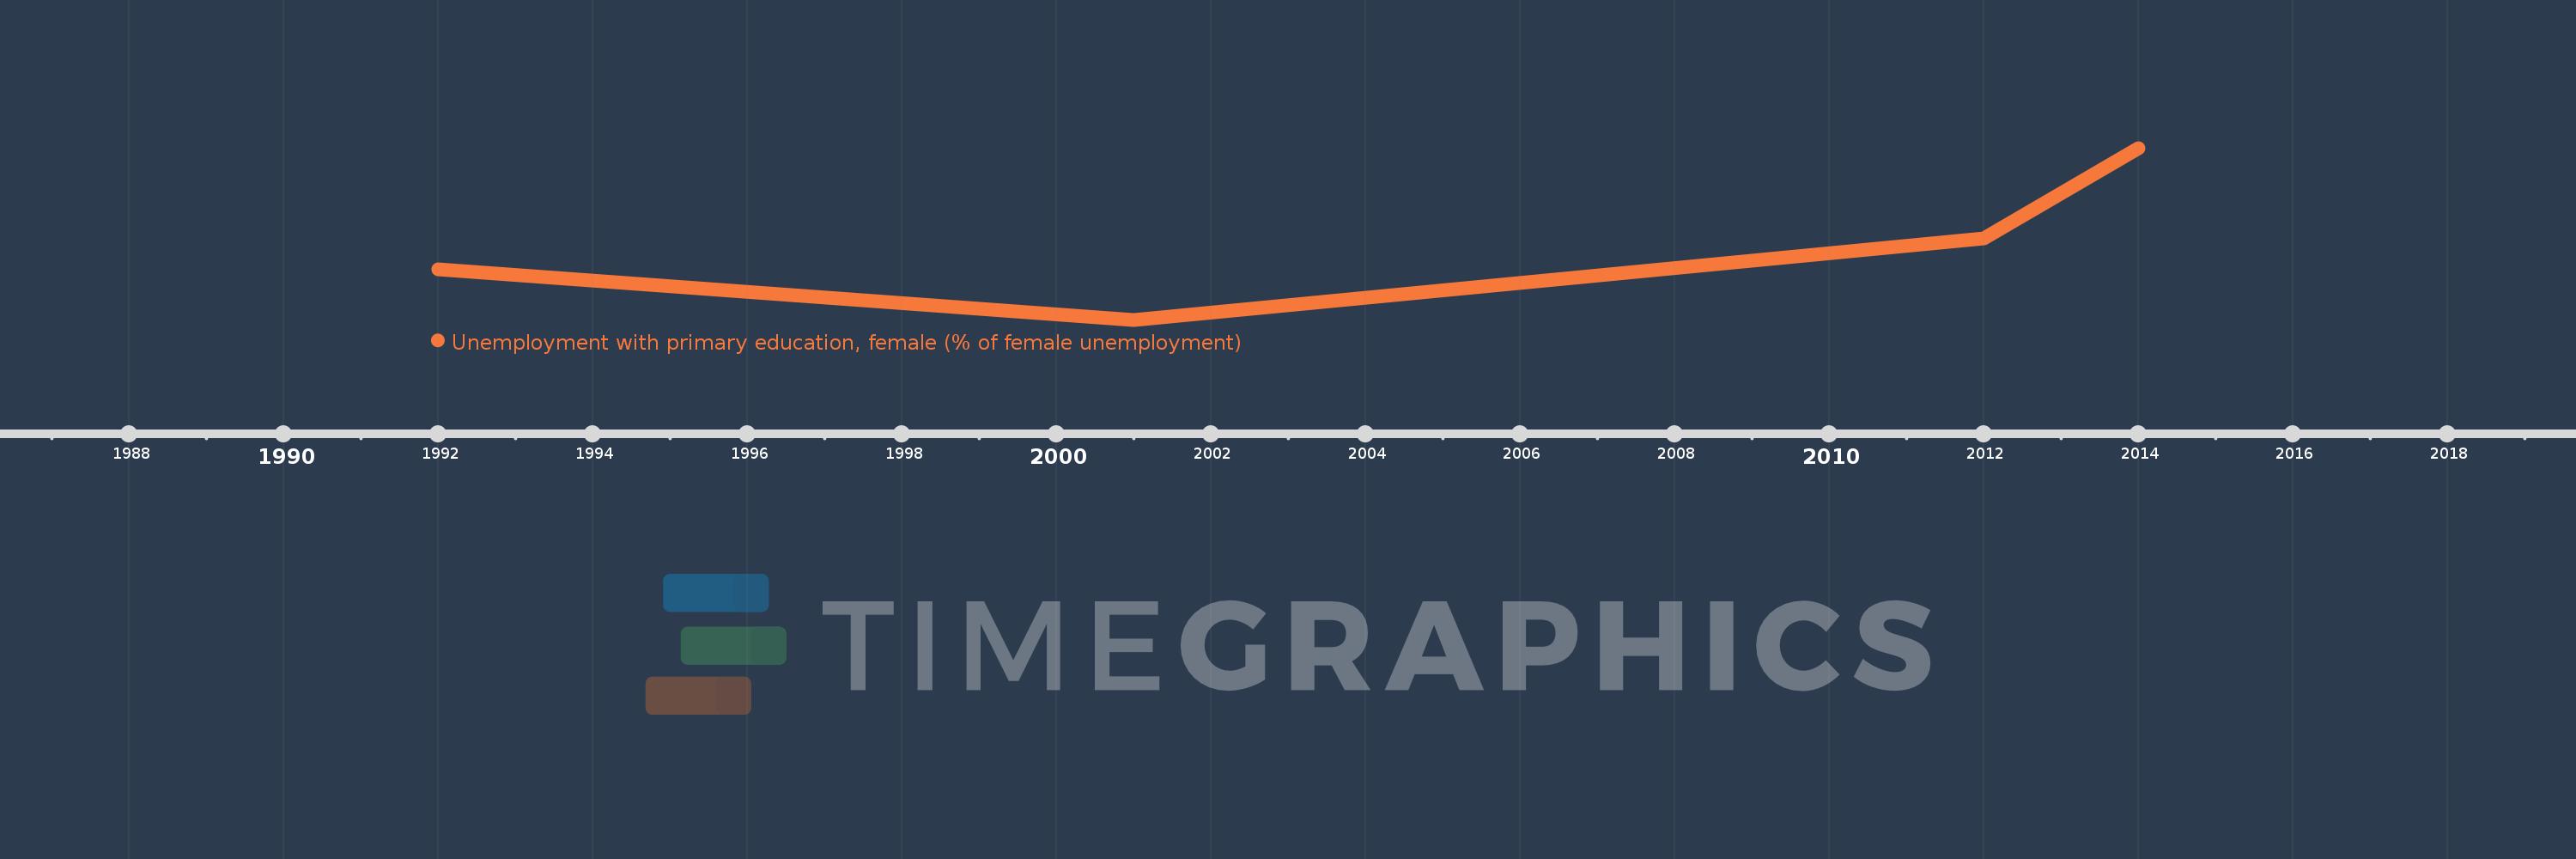
This timeline shows a graph from 1992 to 2014 of Tanzania. No data until 1991. Number of actual observations by date: 4.
Source name:
World Development Indicators
Source organization:
International Labour Organization, Key Indicators of the Labour Market database.
Categories, topics:
Social Protection & Labor, Gender
Last updated:
apr 23, 2017
Indicators value changes by year
At the date of observation
Value
Absolute change
Change from the previous value
jan 1, 1992
73.9
+73.9
0.0%
jan 1, 2001
69.3
-4.6
-6.22%
jan 1, 2012
76.7
+7.4
10.68%
jan 1, 2014
85.0
+8.3
10.82%
Ranking of countries by current statistics by years