33
/
AIzaSyB4mHJ5NPEv-XzF7P6NDYXjlkCWaeKw5bc
November 30, 2025
281657
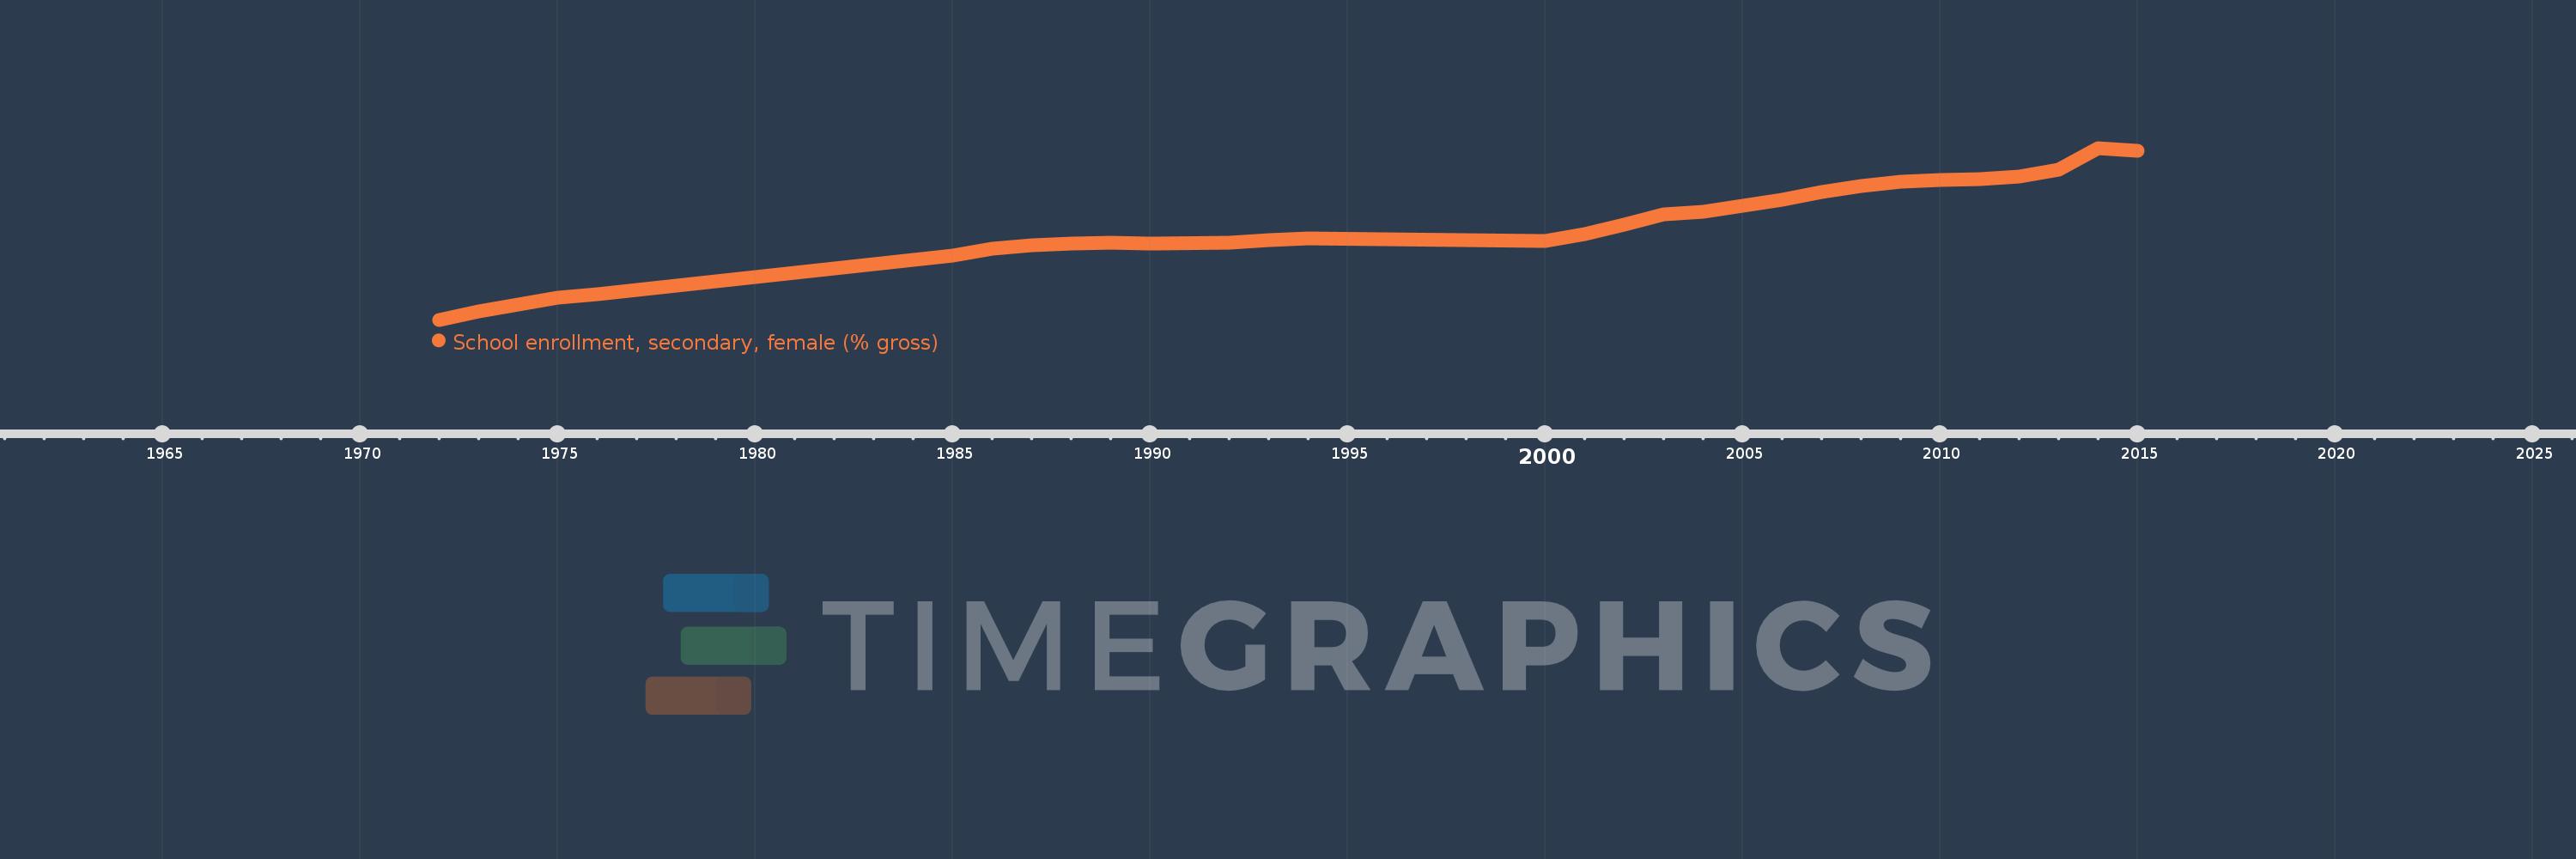
Venezuela, RB
VEN
true
2
1
School enrollment, secondary, female (% gross)
2015,2014,2013,2012,2011,2010,2009,2008,2007,2006,2005,2004,2003,2002,2001,2000,1994,1993,1992,1990,1989,1988,1987,1986,1985,1976,1975,1974,1973,1972