33
/
AIzaSyB4mHJ5NPEv-XzF7P6NDYXjlkCWaeKw5bc
November 30, 2025
262965
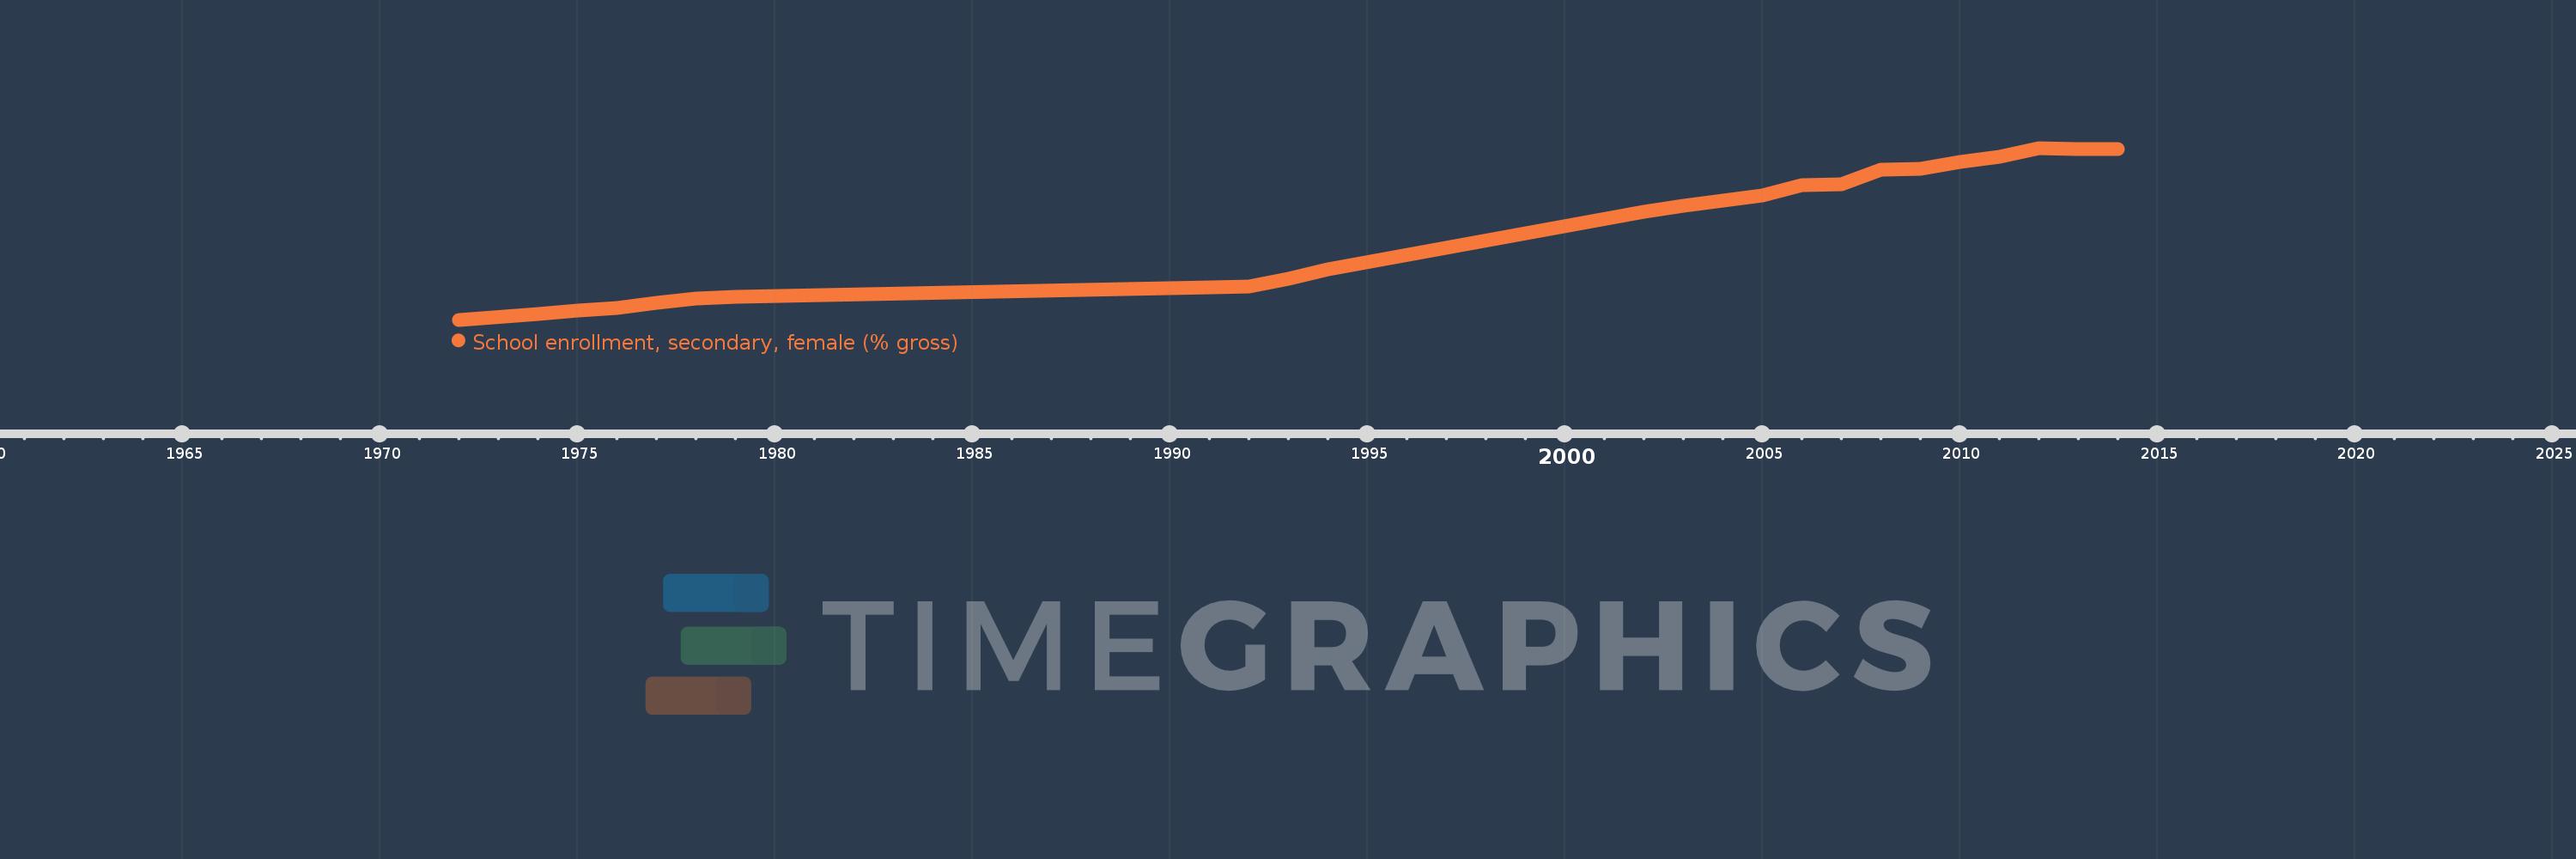
Thailand
THA
true
2
1
School enrollment, secondary, female (% gross)
2014,2013,2012,2011,2010,2009,2008,2007,2006,2005,2003,2002,1994,1993,1992,1991,1979,1978,1977,1976,1975,1974,1972