33
/
AIzaSyB4mHJ5NPEv-XzF7P6NDYXjlkCWaeKw5bc
November 30, 2025
279496
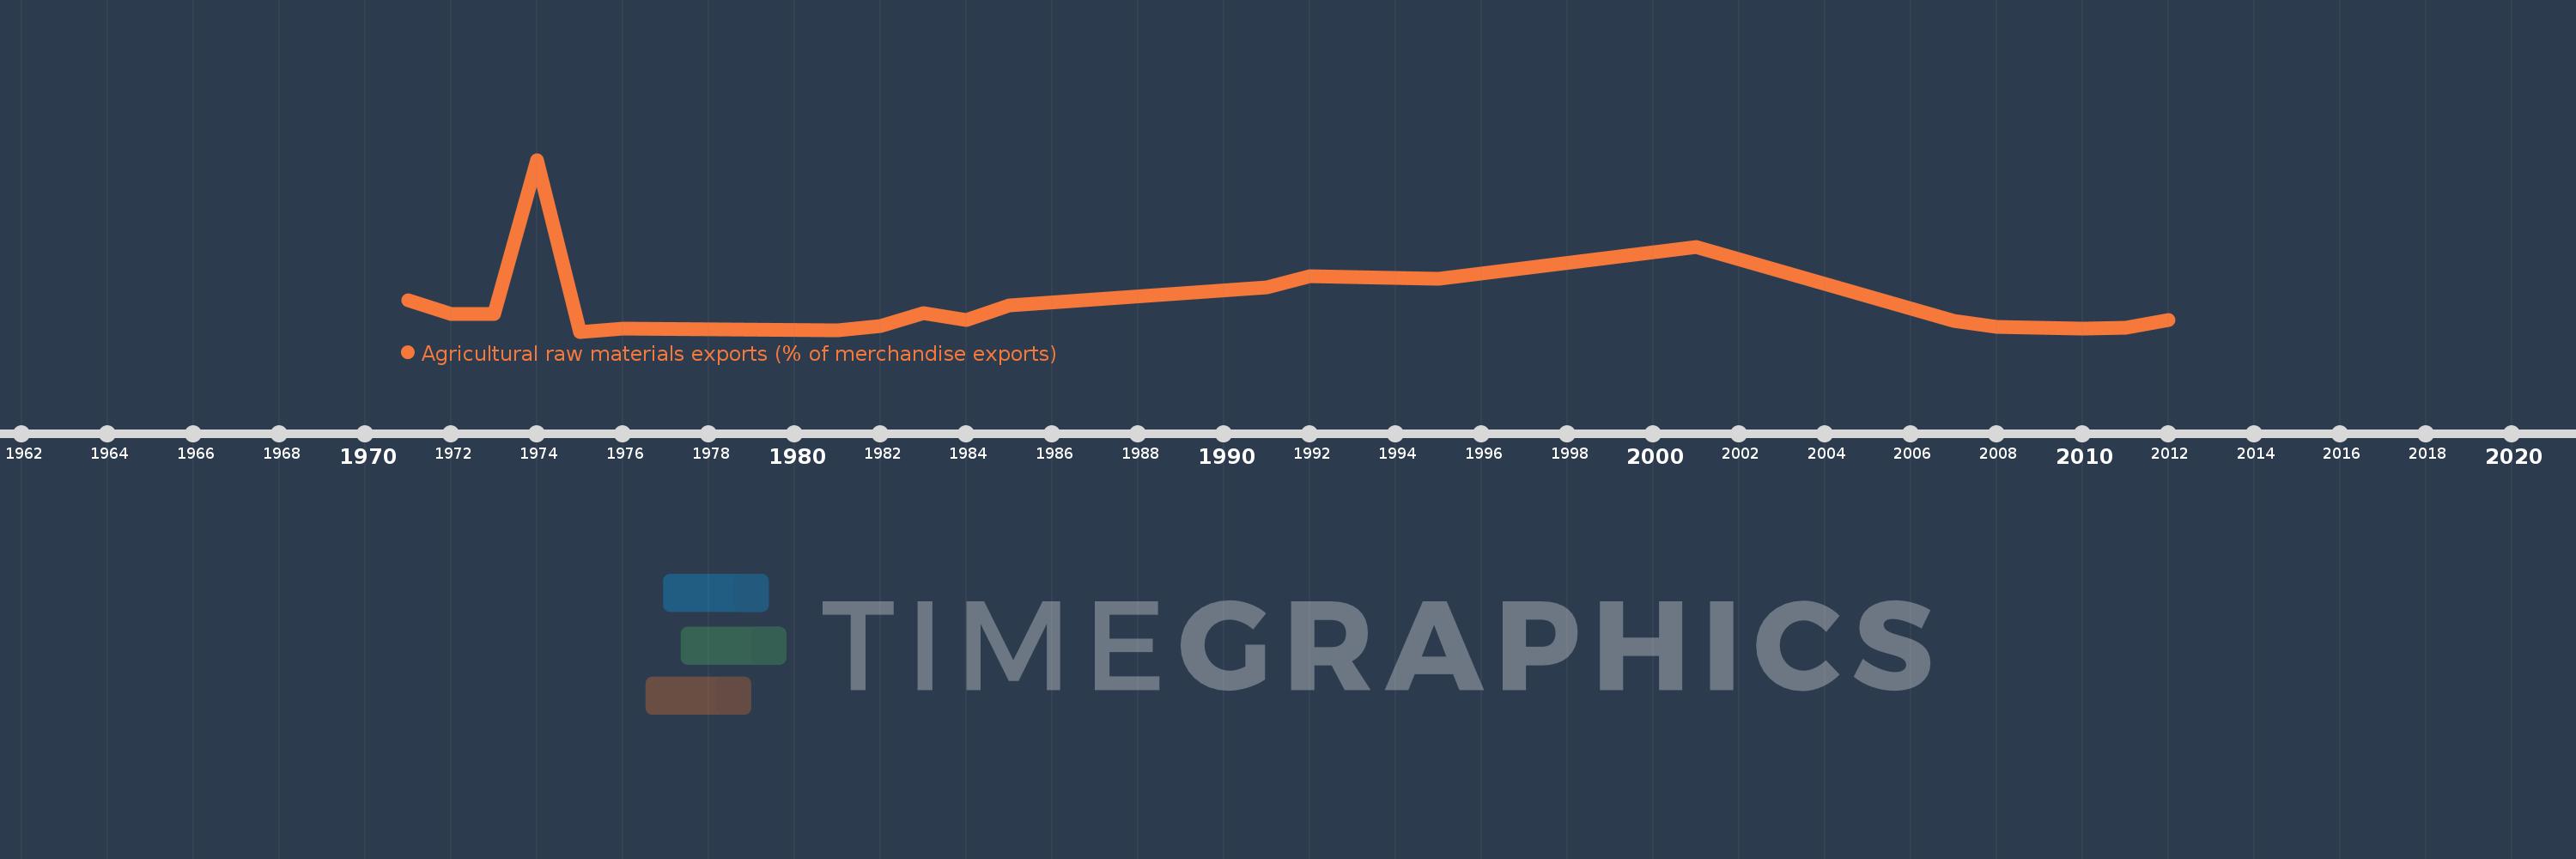
Vanuatu
VUT
true
2
1
Agricultural raw materials exports (% of merchandise exports)
2012,2011,2010,2008,2007,2001,1995,1992,1991,1985,1984,1983,1982,1981,1976,1975,1974,1973,1972,1971