33
/
AIzaSyB4mHJ5NPEv-XzF7P6NDYXjlkCWaeKw5bc
November 30, 2025
219292
Papua New Guinea
PNG
true
2
1
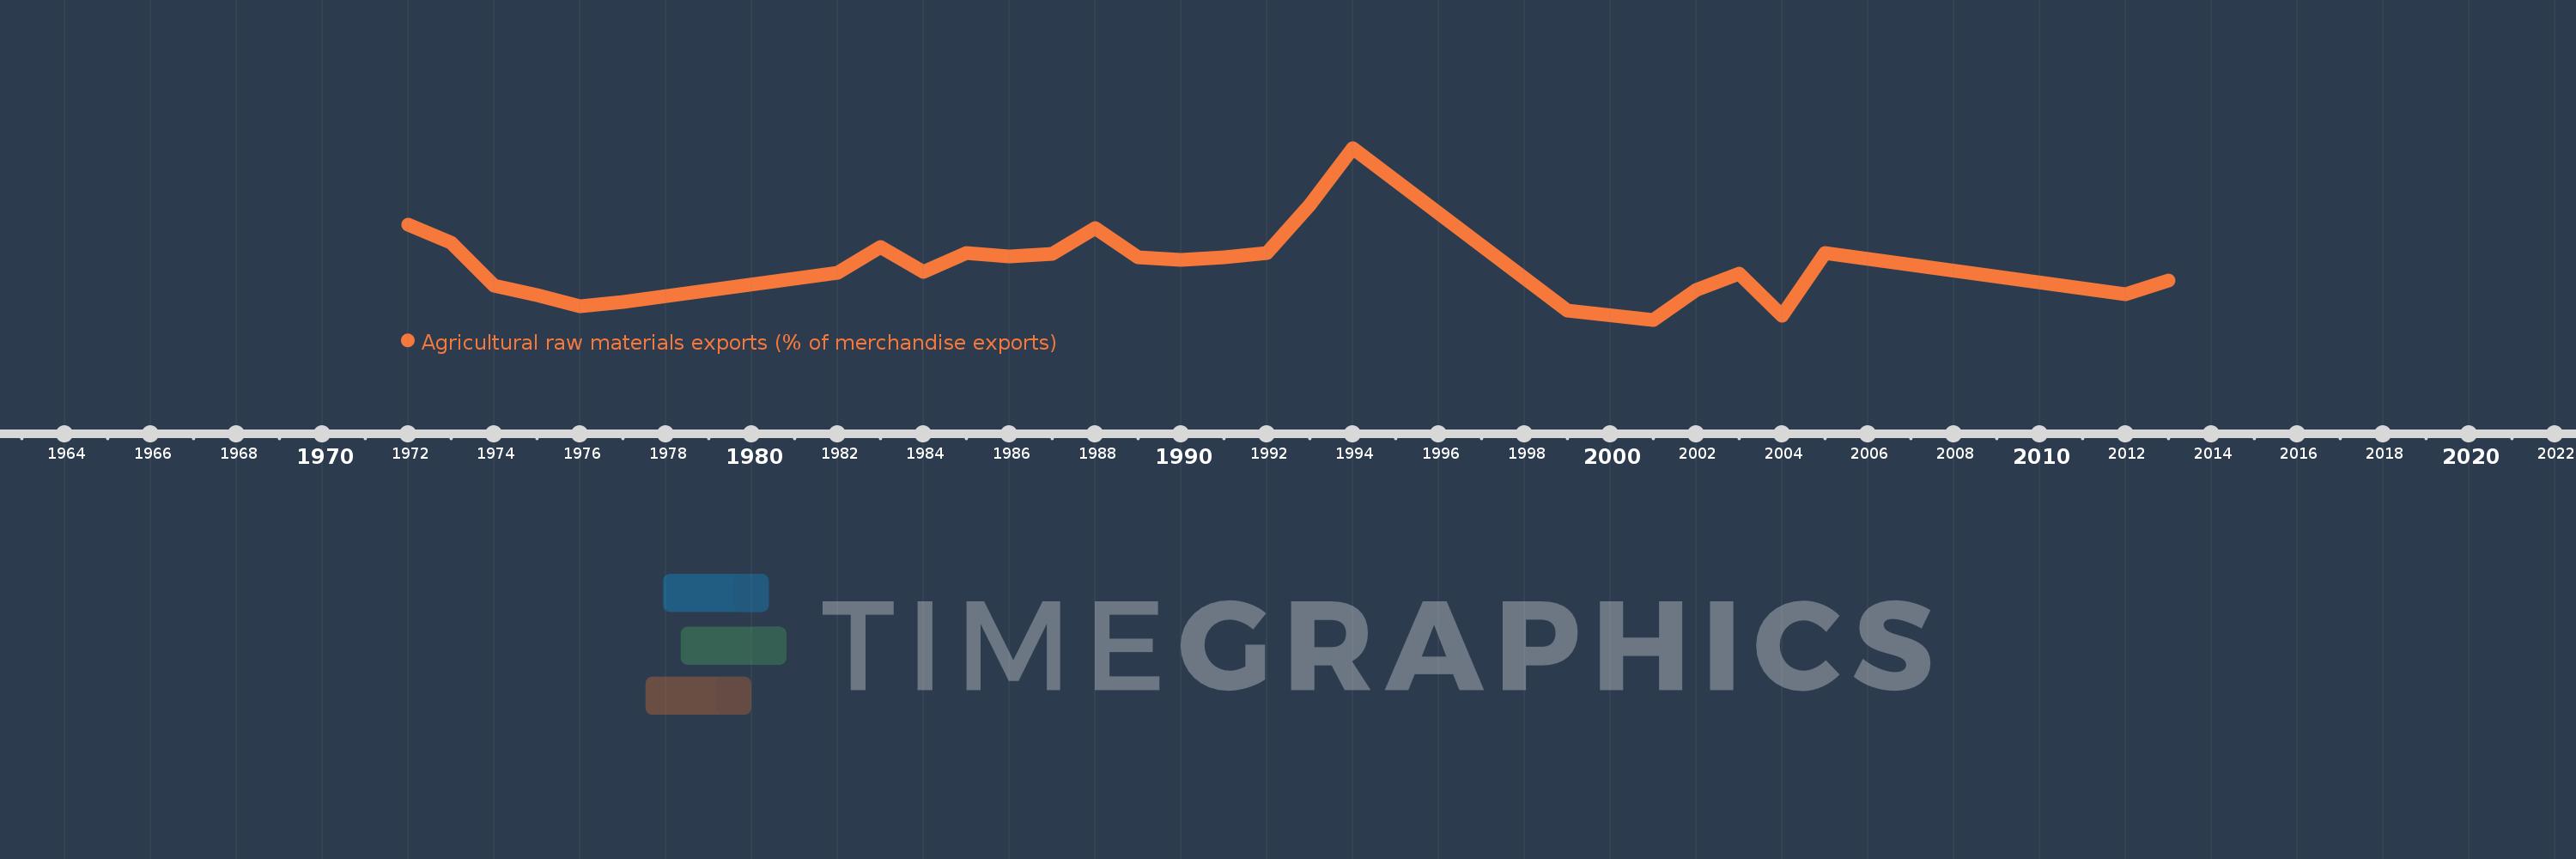
Agricultural raw materials exports (% of merchandise exports)
2013,2012,2005,2004,2003,2002,2001,1999,1994,1993,1992,1991,1990,1989,1988,1987,1986,1985,1984,1983,1982,1977,1976,1975,1974,1973,1972