33
/
AIzaSyB4mHJ5NPEv-XzF7P6NDYXjlkCWaeKw5bc
November 30, 2025
278197
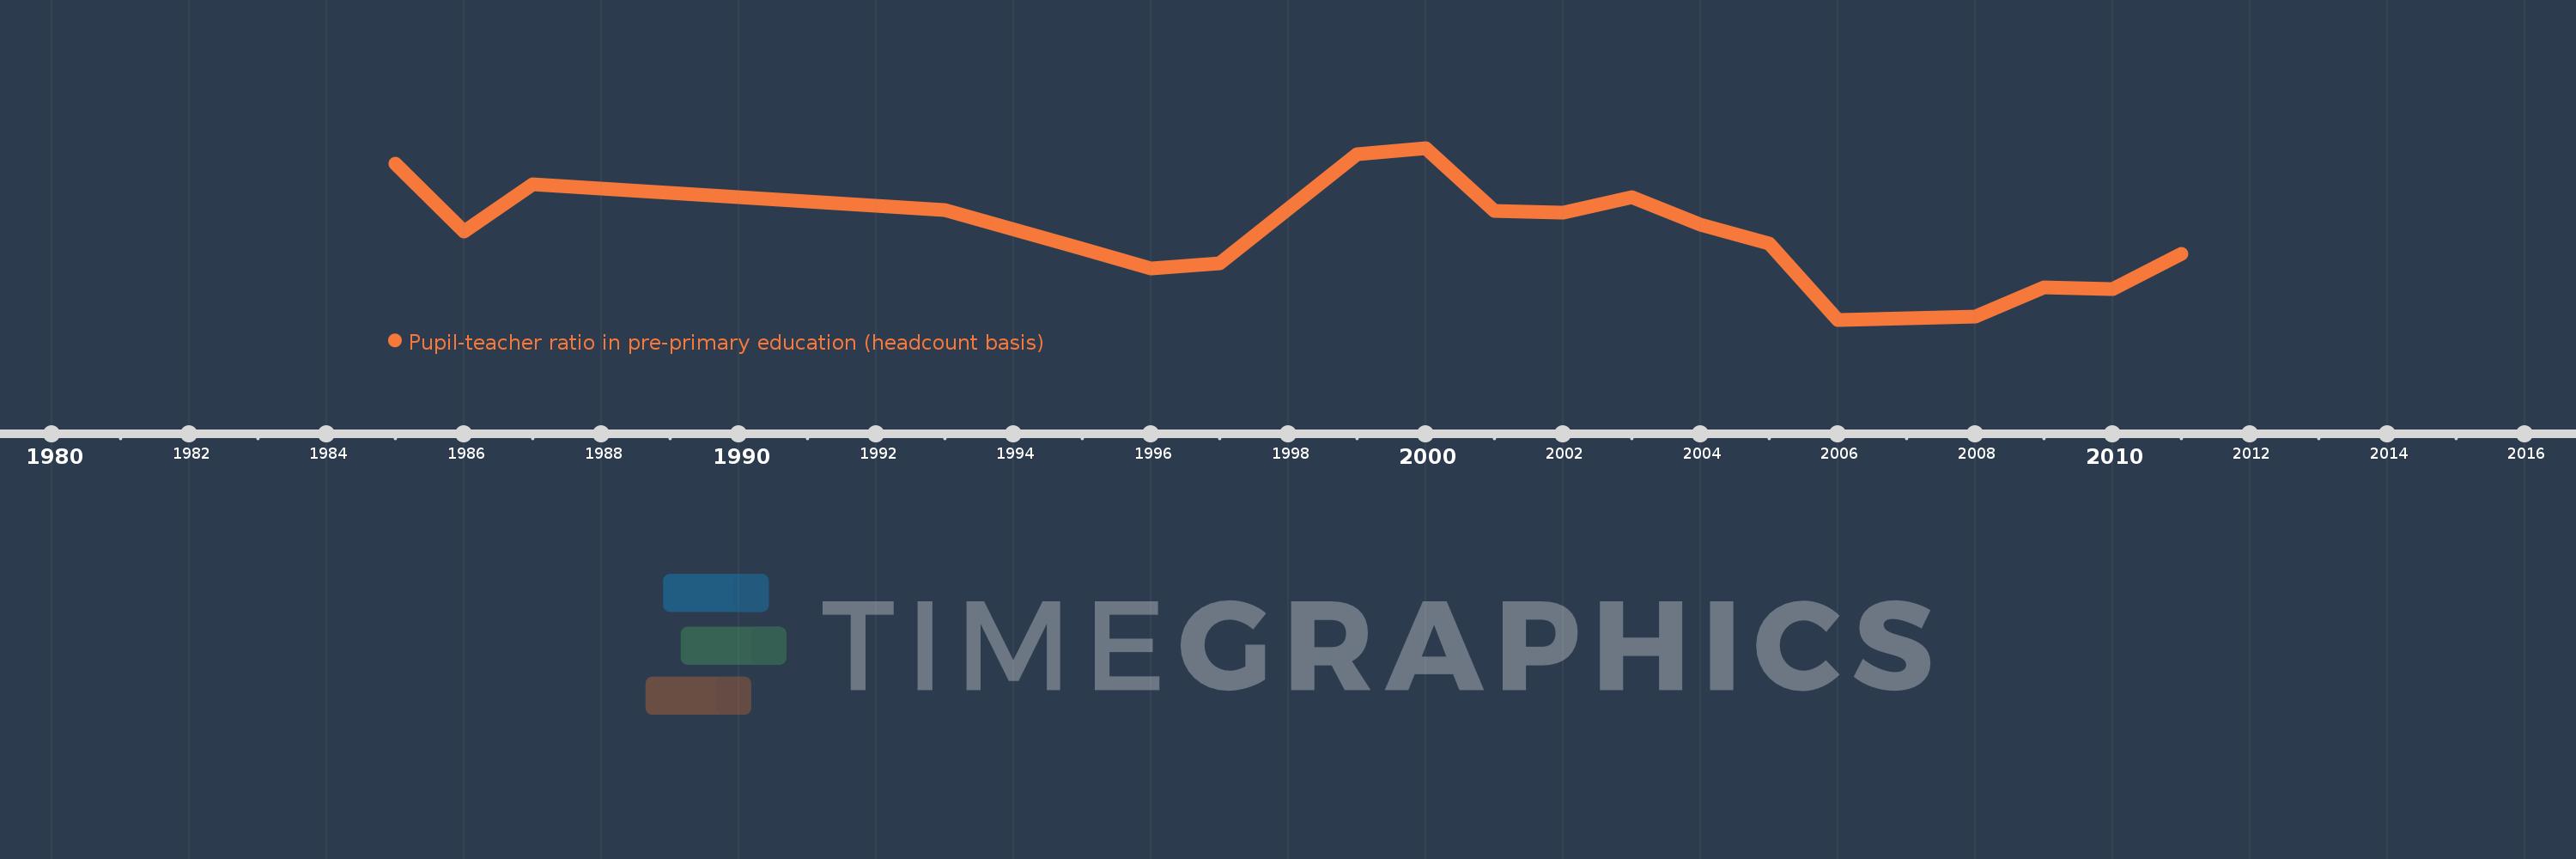
Uruguay
URY
true
2
1
Pupil-teacher ratio in pre-primary education (headcount basis)
2011,2010,2009,2008,2007,2006,2005,2004,2003,2002,2001,2000,1999,1997,1996,1995,1993,1987,1986,1985