33
/
AIzaSyB4mHJ5NPEv-XzF7P6NDYXjlkCWaeKw5bc
November 30, 2025
188429
Malaysia
MYS
true
2
1
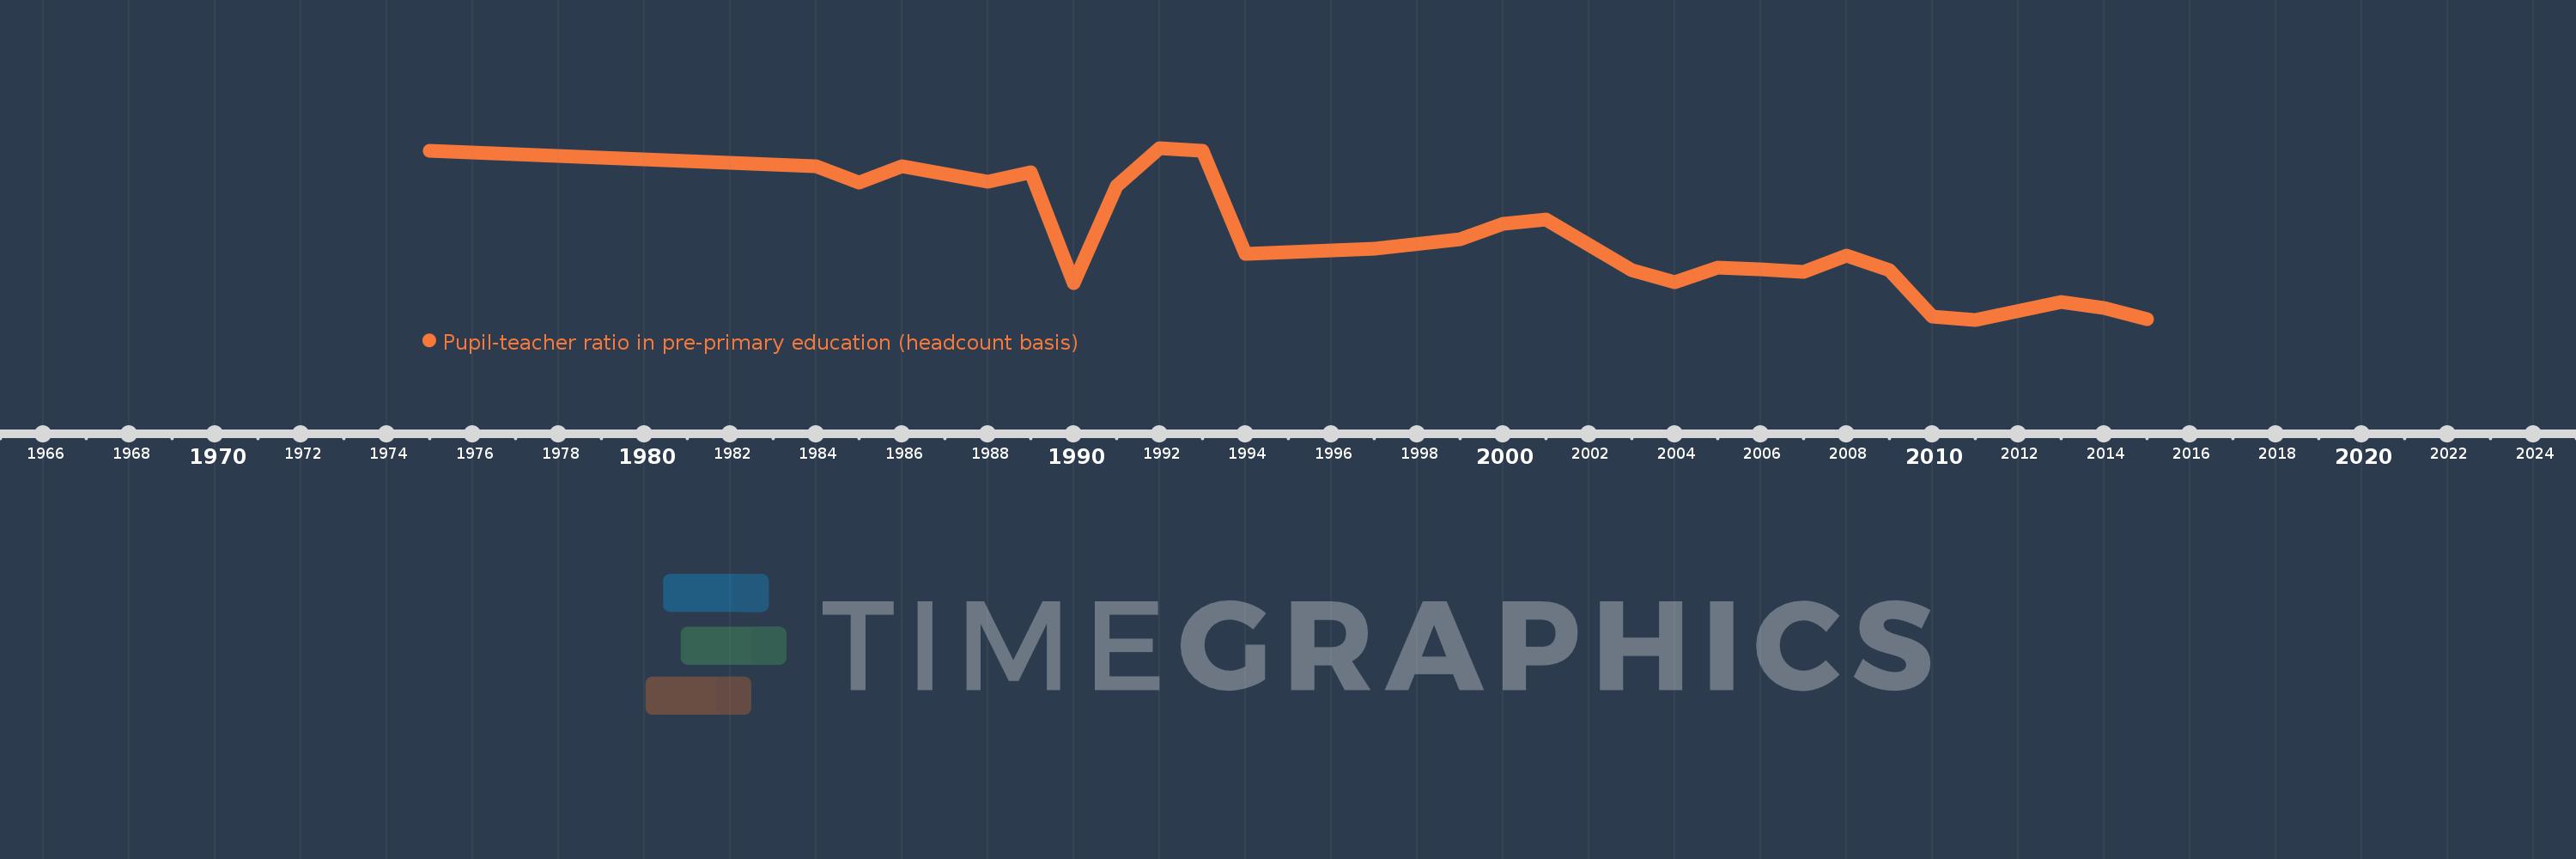
Pupil-teacher ratio in pre-primary education (headcount basis)
2015,2014,2013,2011,2010,2009,2008,2007,2006,2005,2004,2003,2001,2000,1999,1997,1994,1993,1992,1991,1990,1989,1988,1986,1985,1984,1975