33
/
AIzaSyB4mHJ5NPEv-XzF7P6NDYXjlkCWaeKw5bc
November 30, 2025
277731
Uruguay
URY
true
2
1
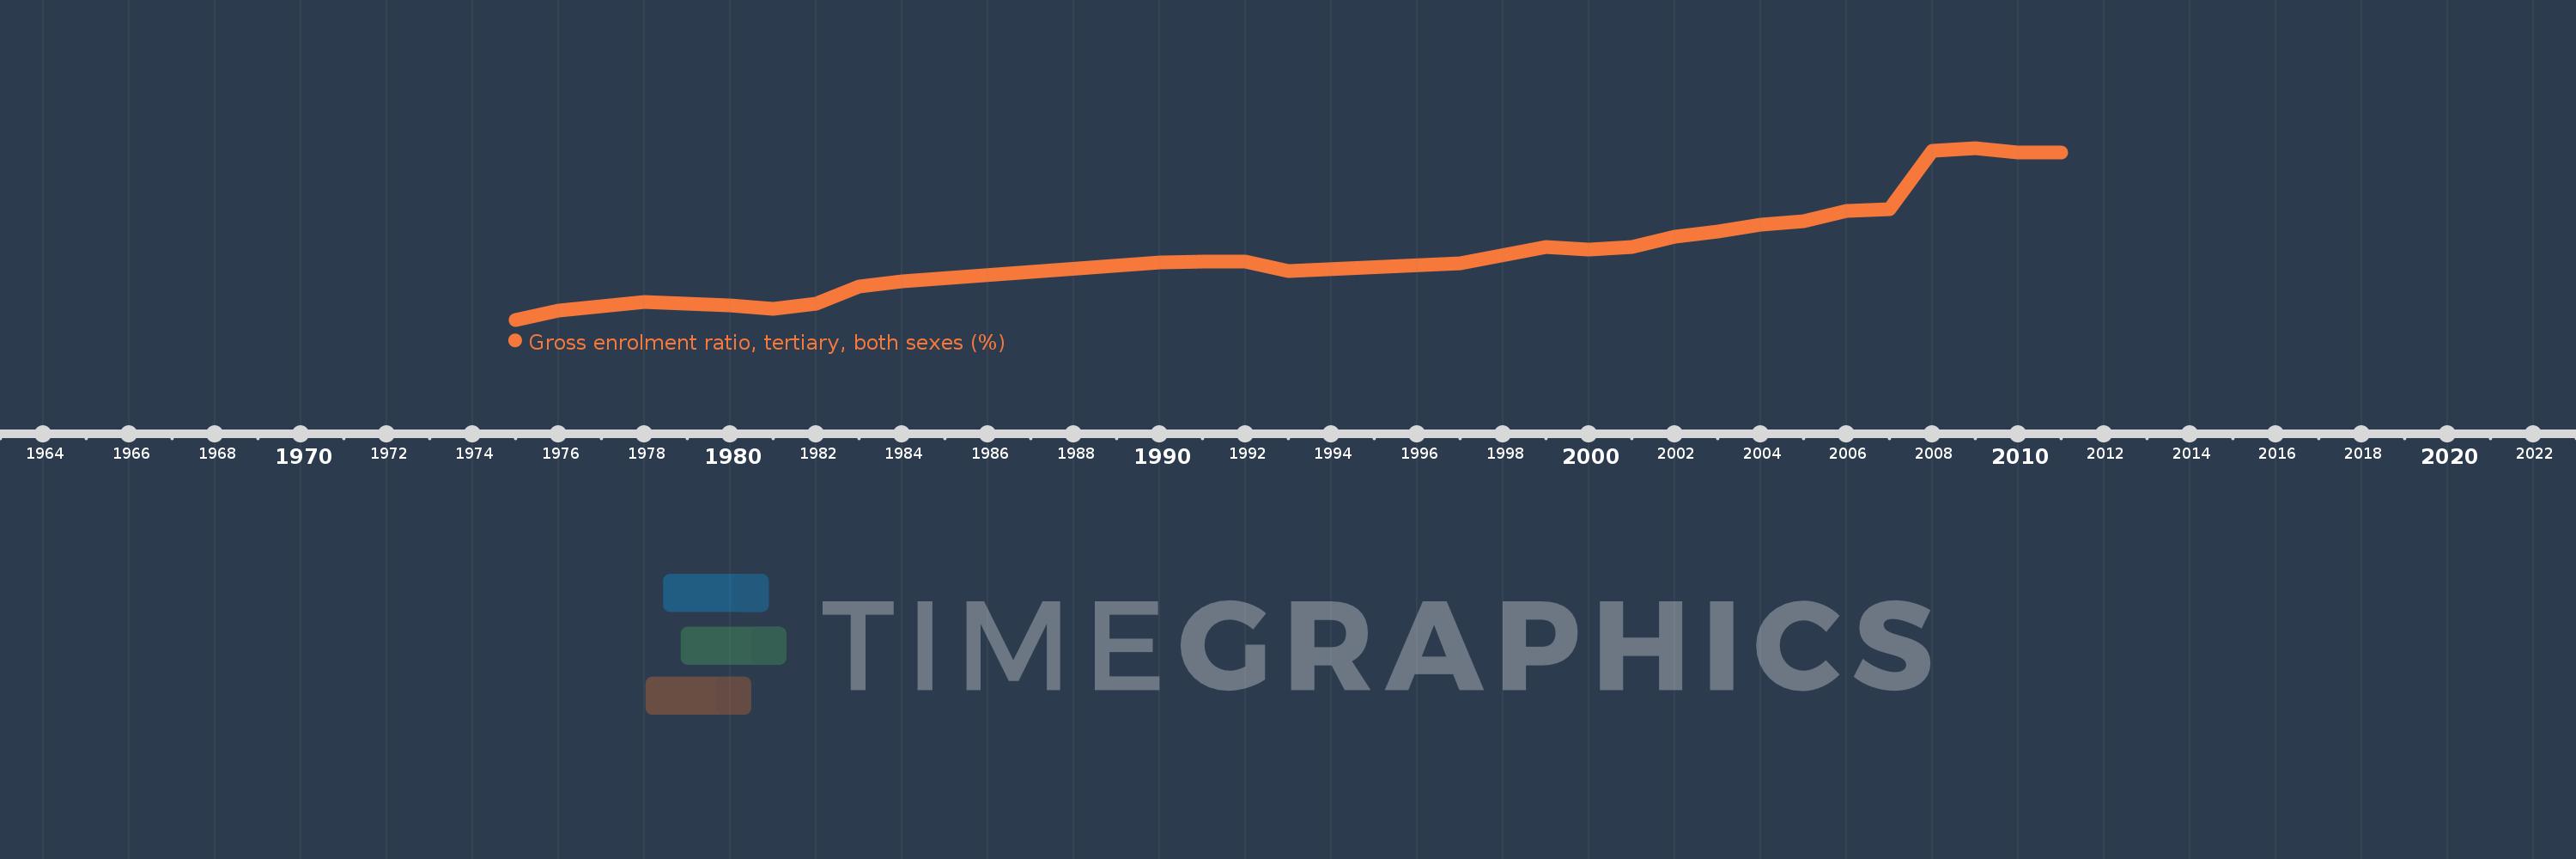
Gross enrolment ratio, tertiary, both sexes (%)
2011,2010,2009,2008,2007,2006,2005,2004,2003,2002,2001,2000,1999,1997,1993,1992,1991,1990,1984,1983,1982,1981,1980,1978,1976,1975