33
/
AIzaSyB4mHJ5NPEv-XzF7P6NDYXjlkCWaeKw5bc
November 30, 2025
204168
Myanmar
MMR
true
2
1
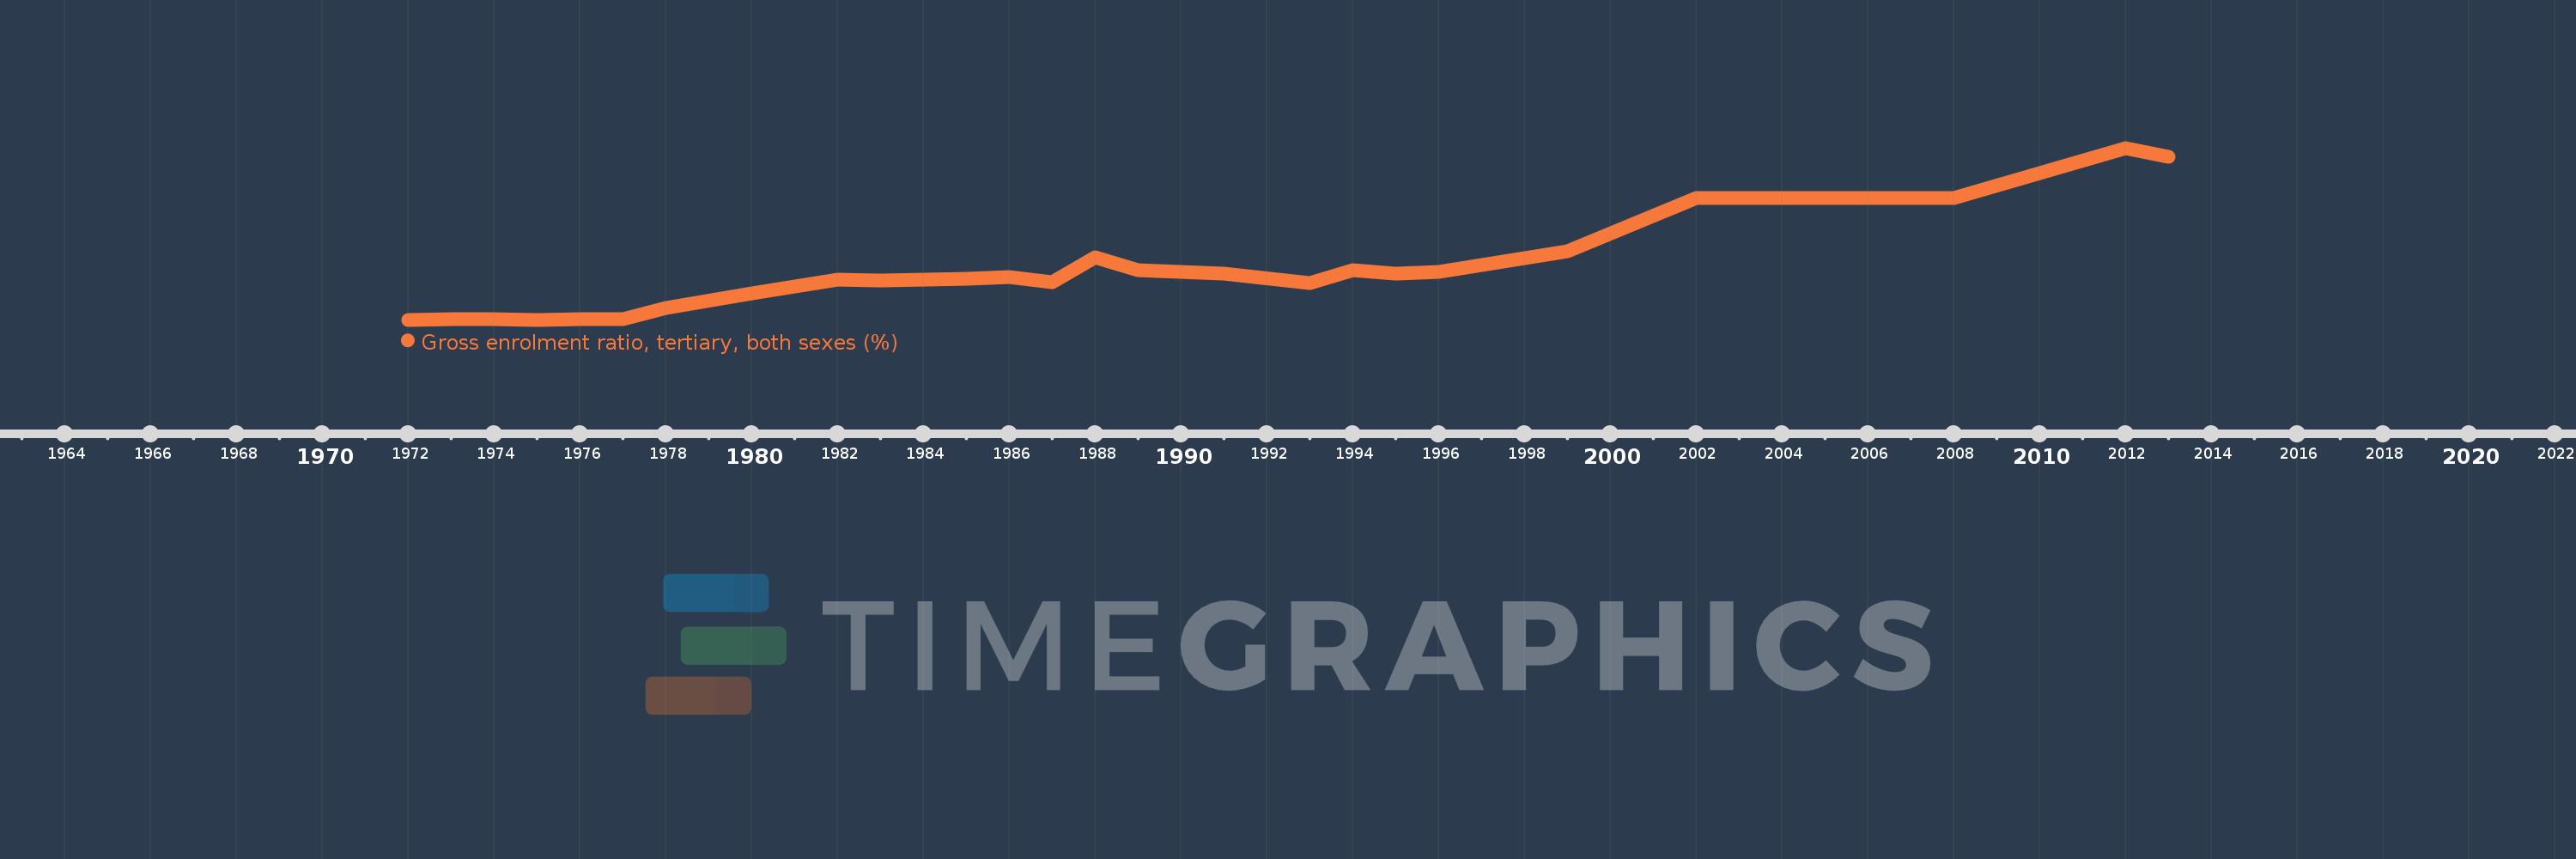
Gross enrolment ratio, tertiary, both sexes (%)
2013,2012,2008,2002,1999,1996,1995,1994,1993,1991,1990,1989,1988,1987,1986,1985,1983,1982,1980,1978,1977,1976,1975,1974,1973,1972