33
/
AIzaSyB4mHJ5NPEv-XzF7P6NDYXjlkCWaeKw5bc
November 30, 2025
273648
Ukraine
UKR
true
2
1
Gross fixed capital formation, private sector (% of GDP)
2010,2009,2008,2007,2006,2005,2004,2003,2002,2001,2000,1999,1998,1997,1996,1995,1994,1993,1992,1991
Create a timeline
Public Timelines
For education
For educational institutions
For teachers
For students
Cabinet
For educational institutions
For teachers
For students
Open cabinet
FAQ
Close
Create a timeline
Public timelines
FAQ
About & Feedback
Terms
Privacy
FAQ
Support 24/7
Cabinet
Get premium
Donate
Download
Global statistics library
→
Ukraine
→
Gross fixed capital formation, private sector (% of GDP)
This statistics in other country:
Albania
Algeria
Angola
Antigua and Barbuda
Armenia
Australia
Azerbaijan
Bangladesh
Barbados
Belarus
Belize
Benin
Bhutan
Bolivia
Bosnia and Herzegovina
Botswana
Brazil
Bulgaria
Burkina Faso
Burundi
Cabo Verde
Cambodia
Cameroon
Caribbean small states
Central African Republic
Chad
Colombia
Comoros
Congo, Dem. Rep.
Congo, Rep.
Costa Rica
Cote d'Ivoire
Croatia
Djibouti
Dominica
Dominican Republic
Early-demographic dividend
Ecuador
Egypt, Arab Rep.
El Salvador
Equatorial Guinea
Eritrea
Ethiopia
Europe & Central Asia (excluding high income)
Europe & Central Asia (IDA & IBRD countries)
Fiji
Gabon
Gambia, The
Georgia
Ghana
Grenada
Guatemala
Guinea
Guinea-Bissau
Guyana
Haiti
Heavily indebted poor countries (HIPC)
Honduras
Hong Kong SAR, China
IDA only
India
Iran, Islamic Rep.
Iraq
Jamaica
Japan
Jordan
Kazakhstan
Kenya
Kosovo
Kyrgyz Republic
Lao PDR
Latin America & Caribbean
Latin America & Caribbean (excluding high income)
Latin America & the Caribbean (IDA & IBRD countries)
Least developed countries: UN classification
Lebanon
Lesotho
Liberia
Libya
Low income
Lower middle income
Macedonia, FYR
Madagascar
Malawi
Malaysia
Mali
Mauritania
Mauritius
Mexico
Middle East & North Africa (excluding high income)
Middle East & North Africa (IDA & IBRD countries)
Moldova
Mongolia
Montenegro
Mozambique
Namibia
Nepal
Nicaragua
Niger
North America
Oman
Pakistan
Panama
Papua New Guinea
Paraguay
Peru
Philippines
Romania
Russian Federation
Rwanda
Senegal
Serbia
Seychelles
Sierra Leone
South Africa
South Asia
South Asia (IDA & IBRD)
South Sudan
Sri Lanka
St. Kitts and Nevis
St. Lucia
St. Vincent and the Grenadines
Sub-Saharan Africa
Sub-Saharan Africa (excluding high income)
Sub-Saharan Africa (IDA & IBRD countries)
Sudan
Suriname
Swaziland
Syrian Arab Republic
Tajikistan
Tanzania
Thailand
Timor-Leste
Togo
Trinidad and Tobago
Tunisia
Turkey
Turkmenistan
Uganda
Ukraine
United Arab Emirates
United States
Uruguay
Uzbekistan
Venezuela, RB
Yemen, Rep.
Zimbabwe
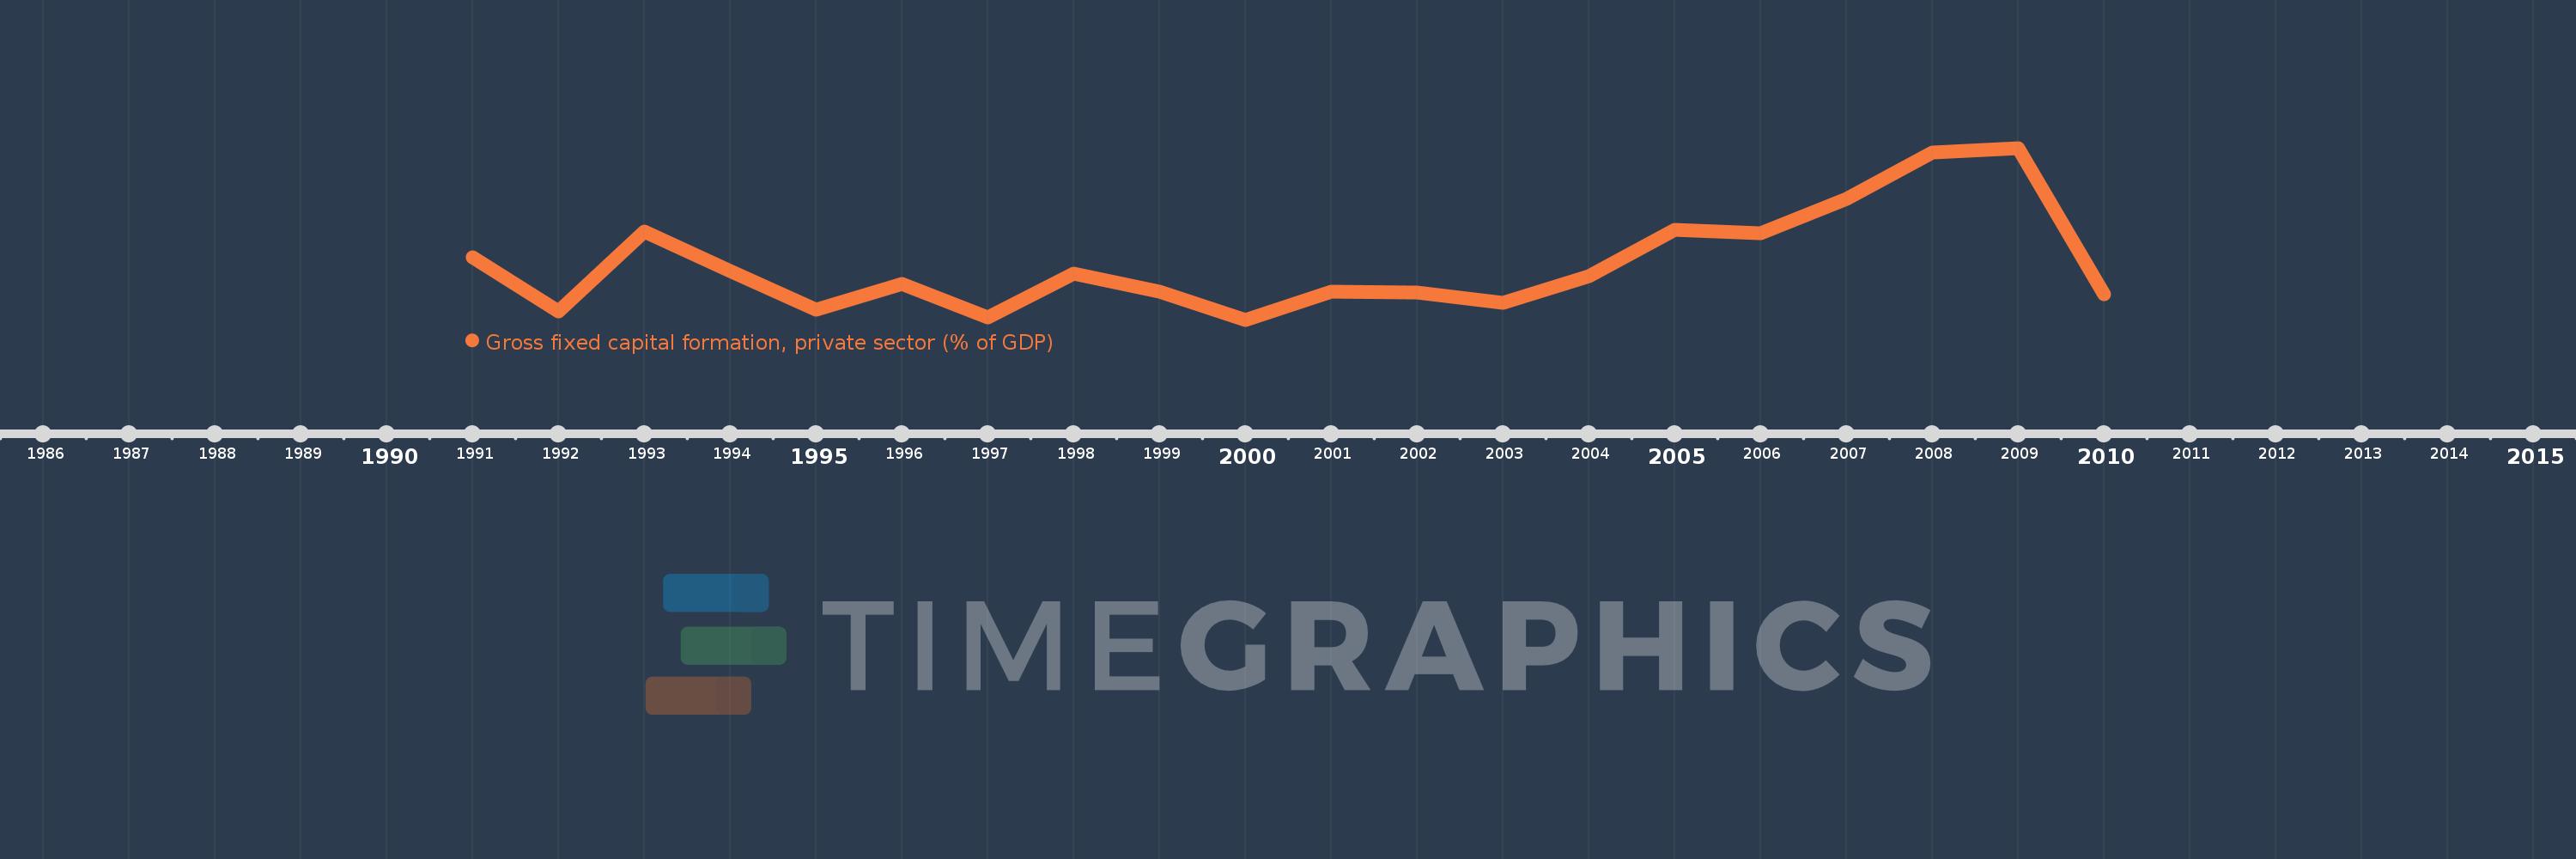
Timeline:
This timeline shows a graph from
1991
to
2010
of Ukraine. No data until
1990
. Number of actual observations by date:
20
.
Source name:
World Development Indicators
Source organization:
World Bank national accounts data, and OECD National Accounts data files.
Categories, topics:
Economy & Growth
Last updated:
apr 23, 2017
Indicators value changes by year
Meaning:
18.613
Minimum:
15.991
jan 1, 2000
Maximum:
24.133
jan 1, 2009
At the date of observation
Value
Absolute change
Change from the previous value
jan 1, 1991
18.931
+18.931
0.0%
jan 1, 1992
16.384
-2.547
-13.46%
jan 1, 1993
20.16
+3.776
23.05%
jan 1, 1994
18.281
-1.879
-9.32%
jan 1, 1995
16.461
-1.82
-9.96%
jan 1, 1996
17.7
+1.239
7.53%
jan 1, 1997
16.083
-1.617
-9.13%
jan 1, 1998
18.158
+2.074
12.9%
jan 1, 1999
17.336
-0.821
-4.52%
jan 1, 2000
15.991
-1.345
-7.76%
jan 1, 2001
17.328
+1.337
8.36%
jan 1, 2002
17.276
-0.053
-0.3%
jan 1, 2003
16.806
-0.47
-2.72%
jan 1, 2004
18.06
+1.254
7.46%
jan 1, 2005
20.233
+2.173
12.03%
jan 1, 2006
20.106
-0.127
-0.63%
jan 1, 2007
21.733
+1.627
8.09%
jan 1, 2008
23.923
+2.189
10.07%
jan 1, 2009
24.133
+0.21
0.88%
jan 1, 2010
17.18
-6.953
-28.81%
Ranking of countries by current statistics by years
About & Feedback
Terms
Privacy
FAQ
Support 24/7
Cabinet
Get premium
Donate
The service accepts bank transfer (ACH, Wire) or cards (Visa, MasterCard, etc). Processed by Stripe.
Secured with SSL