Download This statistics in other country:
Timeline:
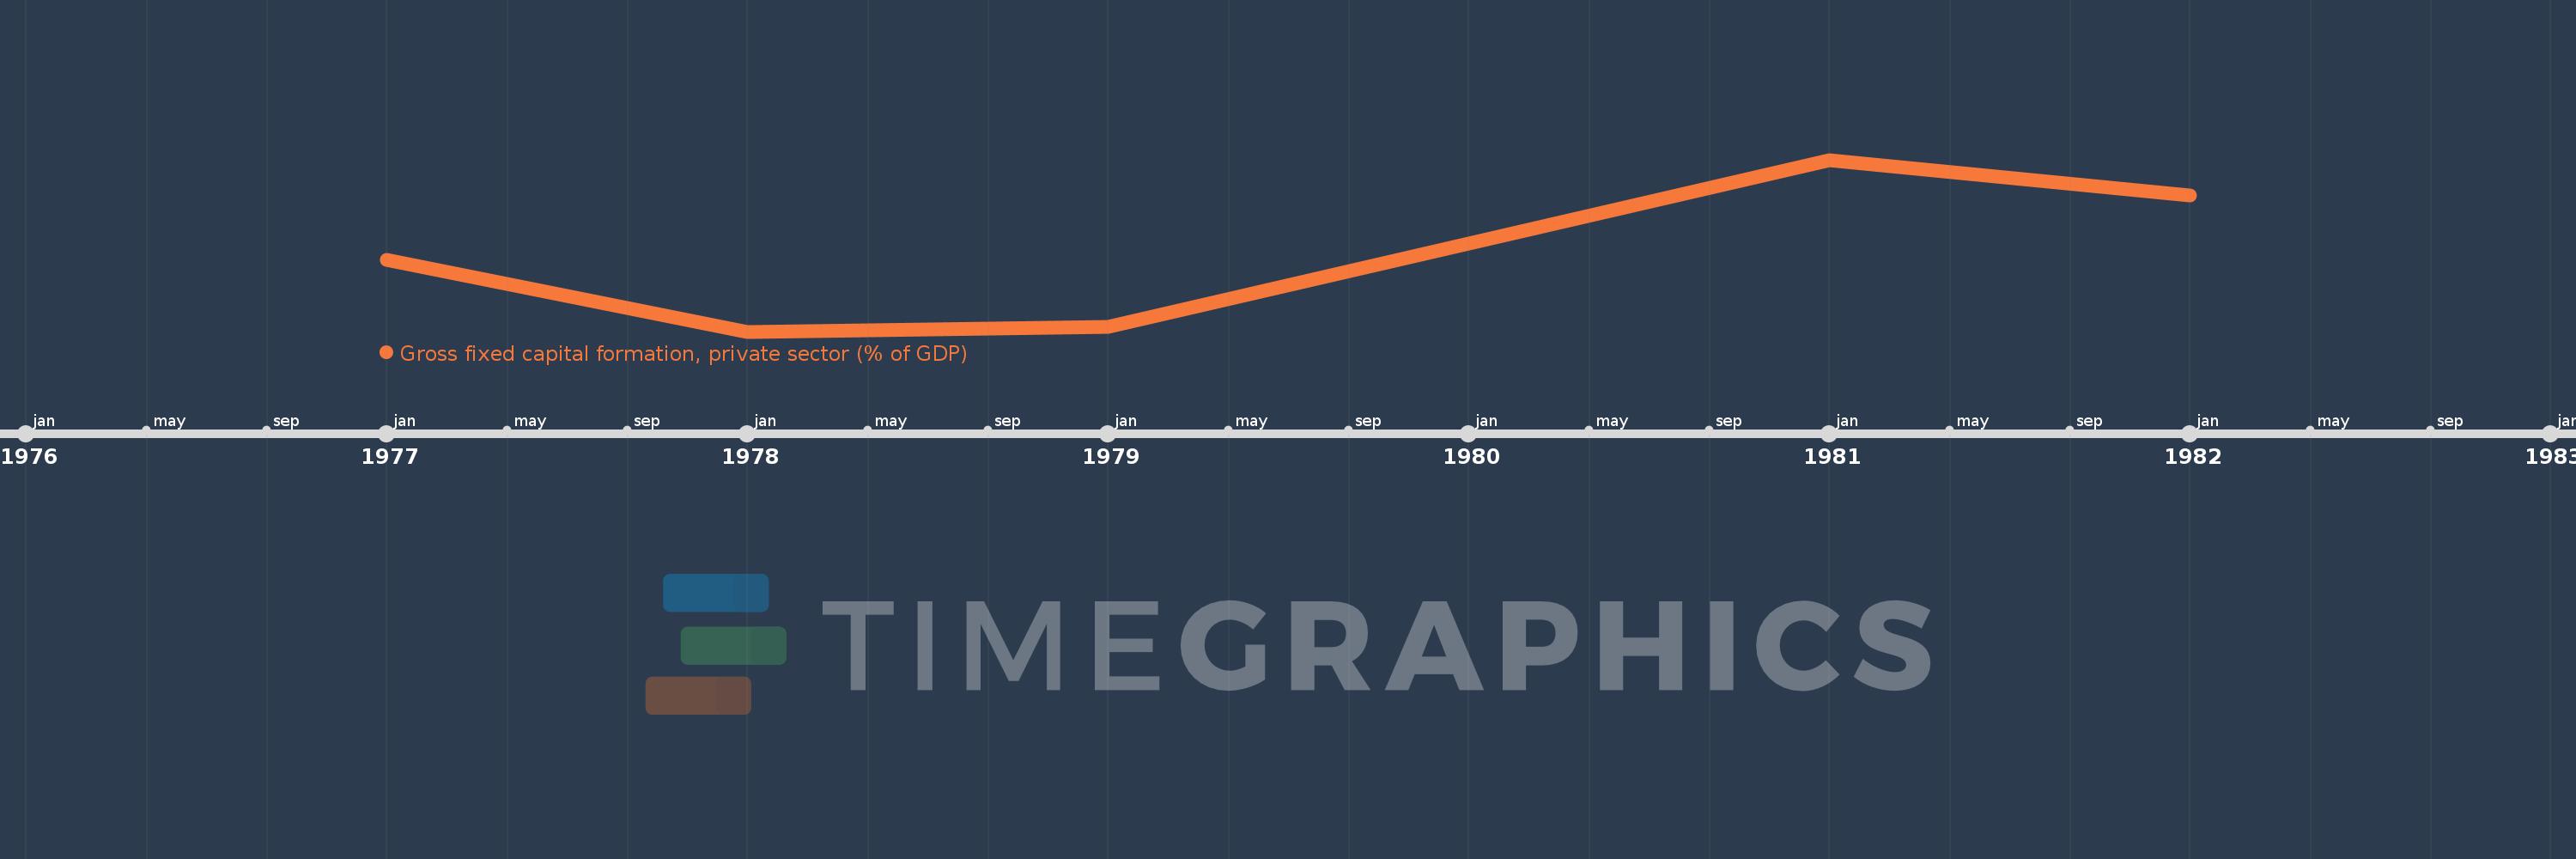
This timeline shows a graph from 1977 to 1982 of Lesotho. No data until 1976. Number of actual observations by date: 5.
Source name:
World Development Indicators
Source organization:
World Bank national accounts data, and OECD National Accounts data files.
Categories, topics:
Economy & Growth
Last updated:
apr 23, 2017
Indicators value changes by year
Maximum:
25.706
jan 1, 1981
At the date of observation
Value
Absolute change
Change from the previous value
jan 1, 1977
13.006
+13.006
0.0%
jan 1, 1978
3.867
-9.139
-70.27%
jan 1, 1979
4.487
+0.62
16.03%
jan 1, 1981
25.706
+21.219
472.95%
jan 1, 1982
21.132
-4.574
-17.79%
Ranking of countries by current statistics by years