33
/
AIzaSyB4mHJ5NPEv-XzF7P6NDYXjlkCWaeKw5bc
November 30, 2025
266723
Trinidad and Tobago
TTO
true
2
1
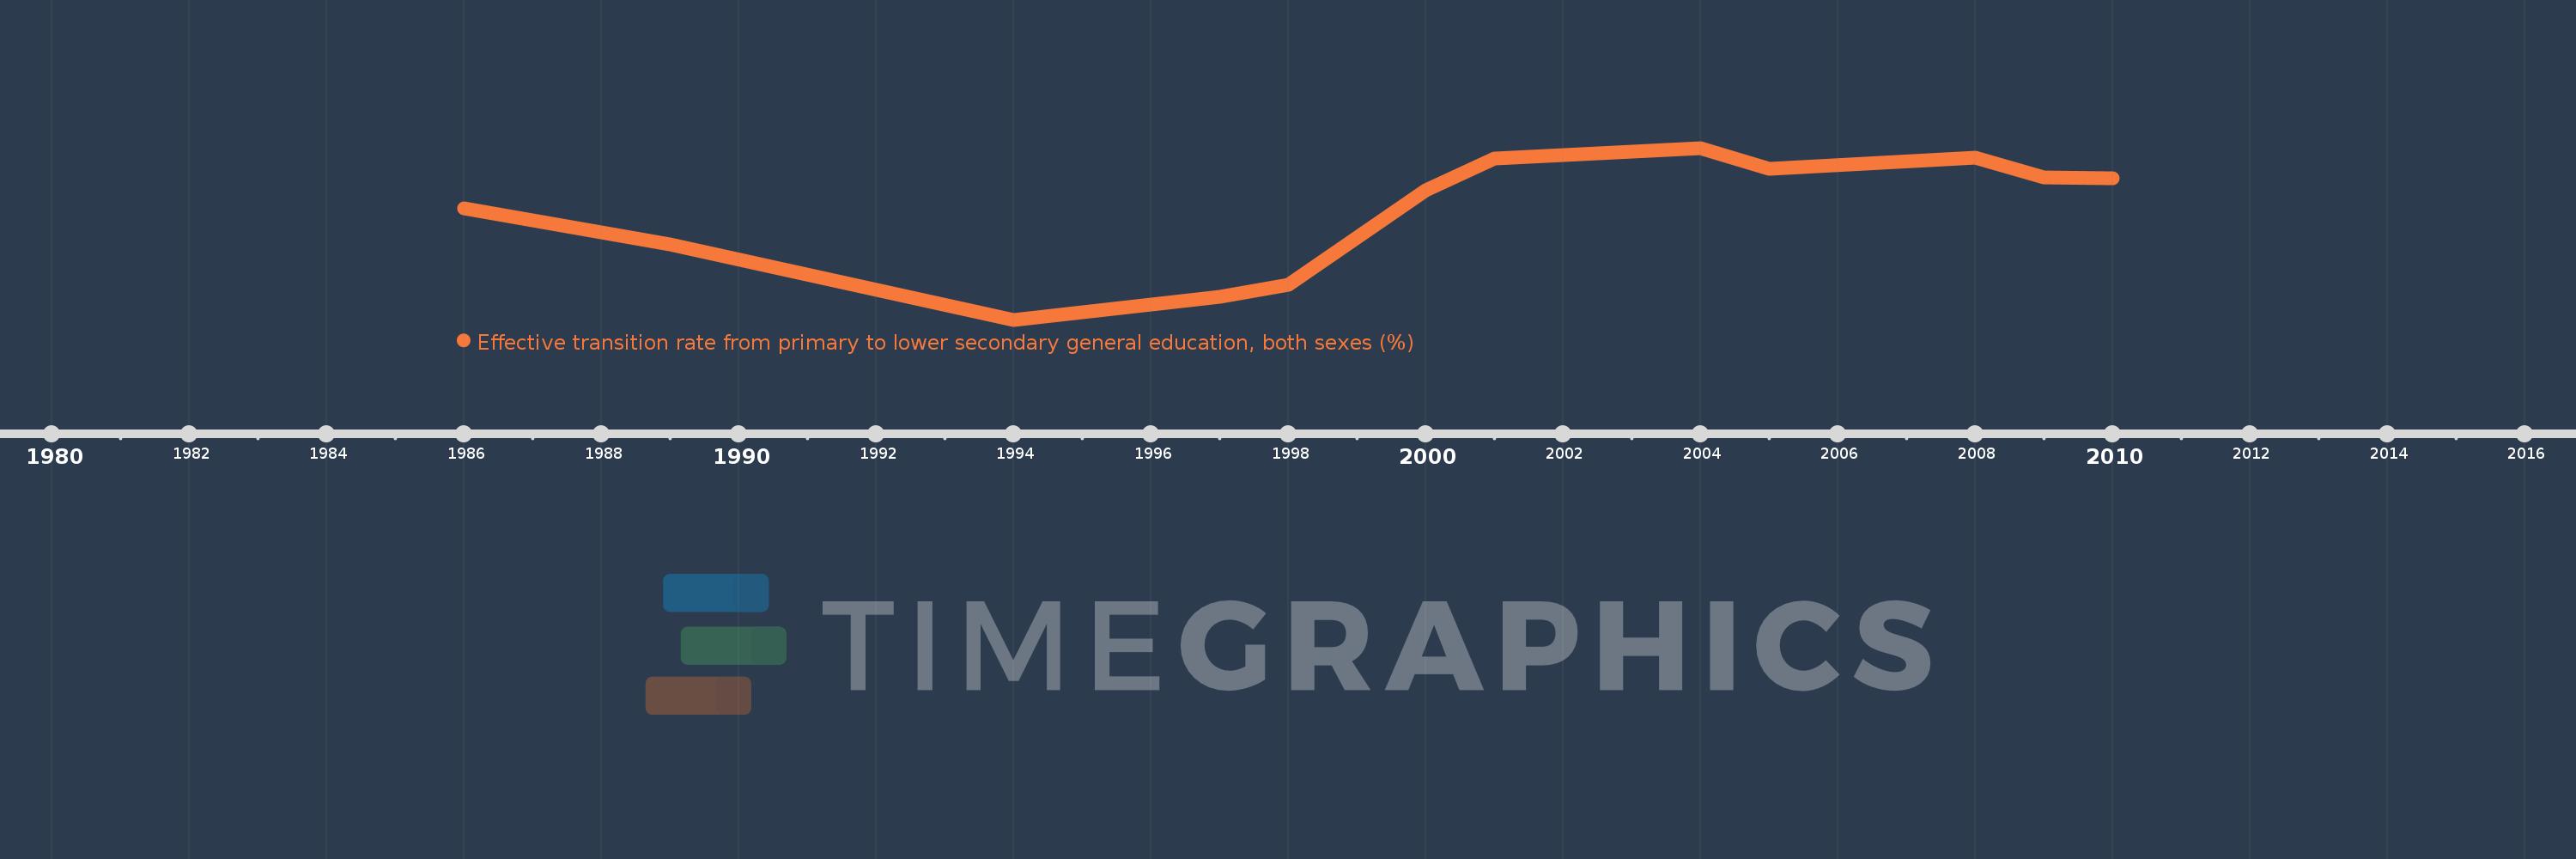
Effective transition rate from primary to lower secondary general education, both sexes (%)
2010,2009,2008,2005,2004,2001,2000,1998,1997,1994,1989,1986