33
/
AIzaSyB4mHJ5NPEv-XzF7P6NDYXjlkCWaeKw5bc
November 30, 2025
247430
Spain
ESP
true
2
1
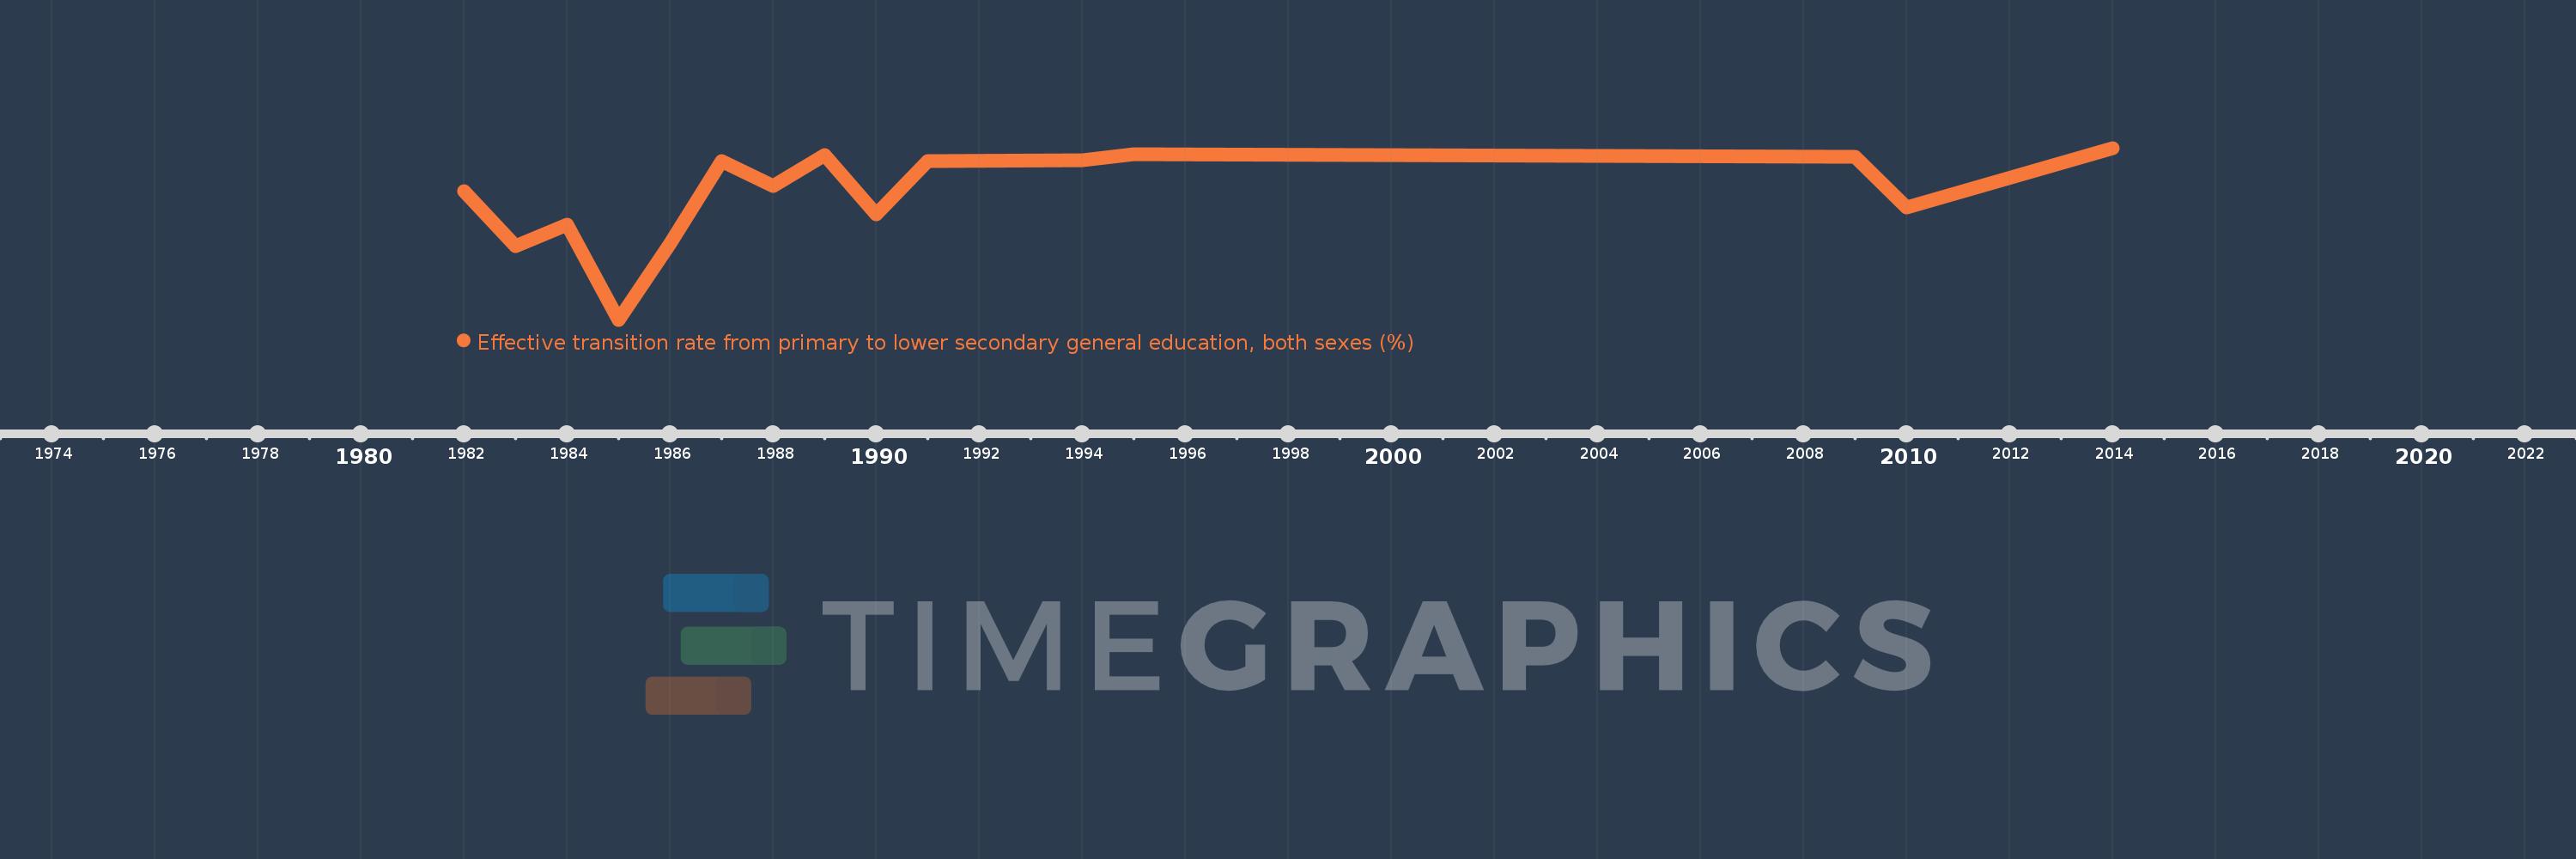
Effective transition rate from primary to lower secondary general education, both sexes (%)
2014,2010,2009,1995,1994,1991,1990,1989,1988,1987,1986,1985,1984,1983,1982