33
/
AIzaSyB4mHJ5NPEv-XzF7P6NDYXjlkCWaeKw5bc
November 30, 2025
265353
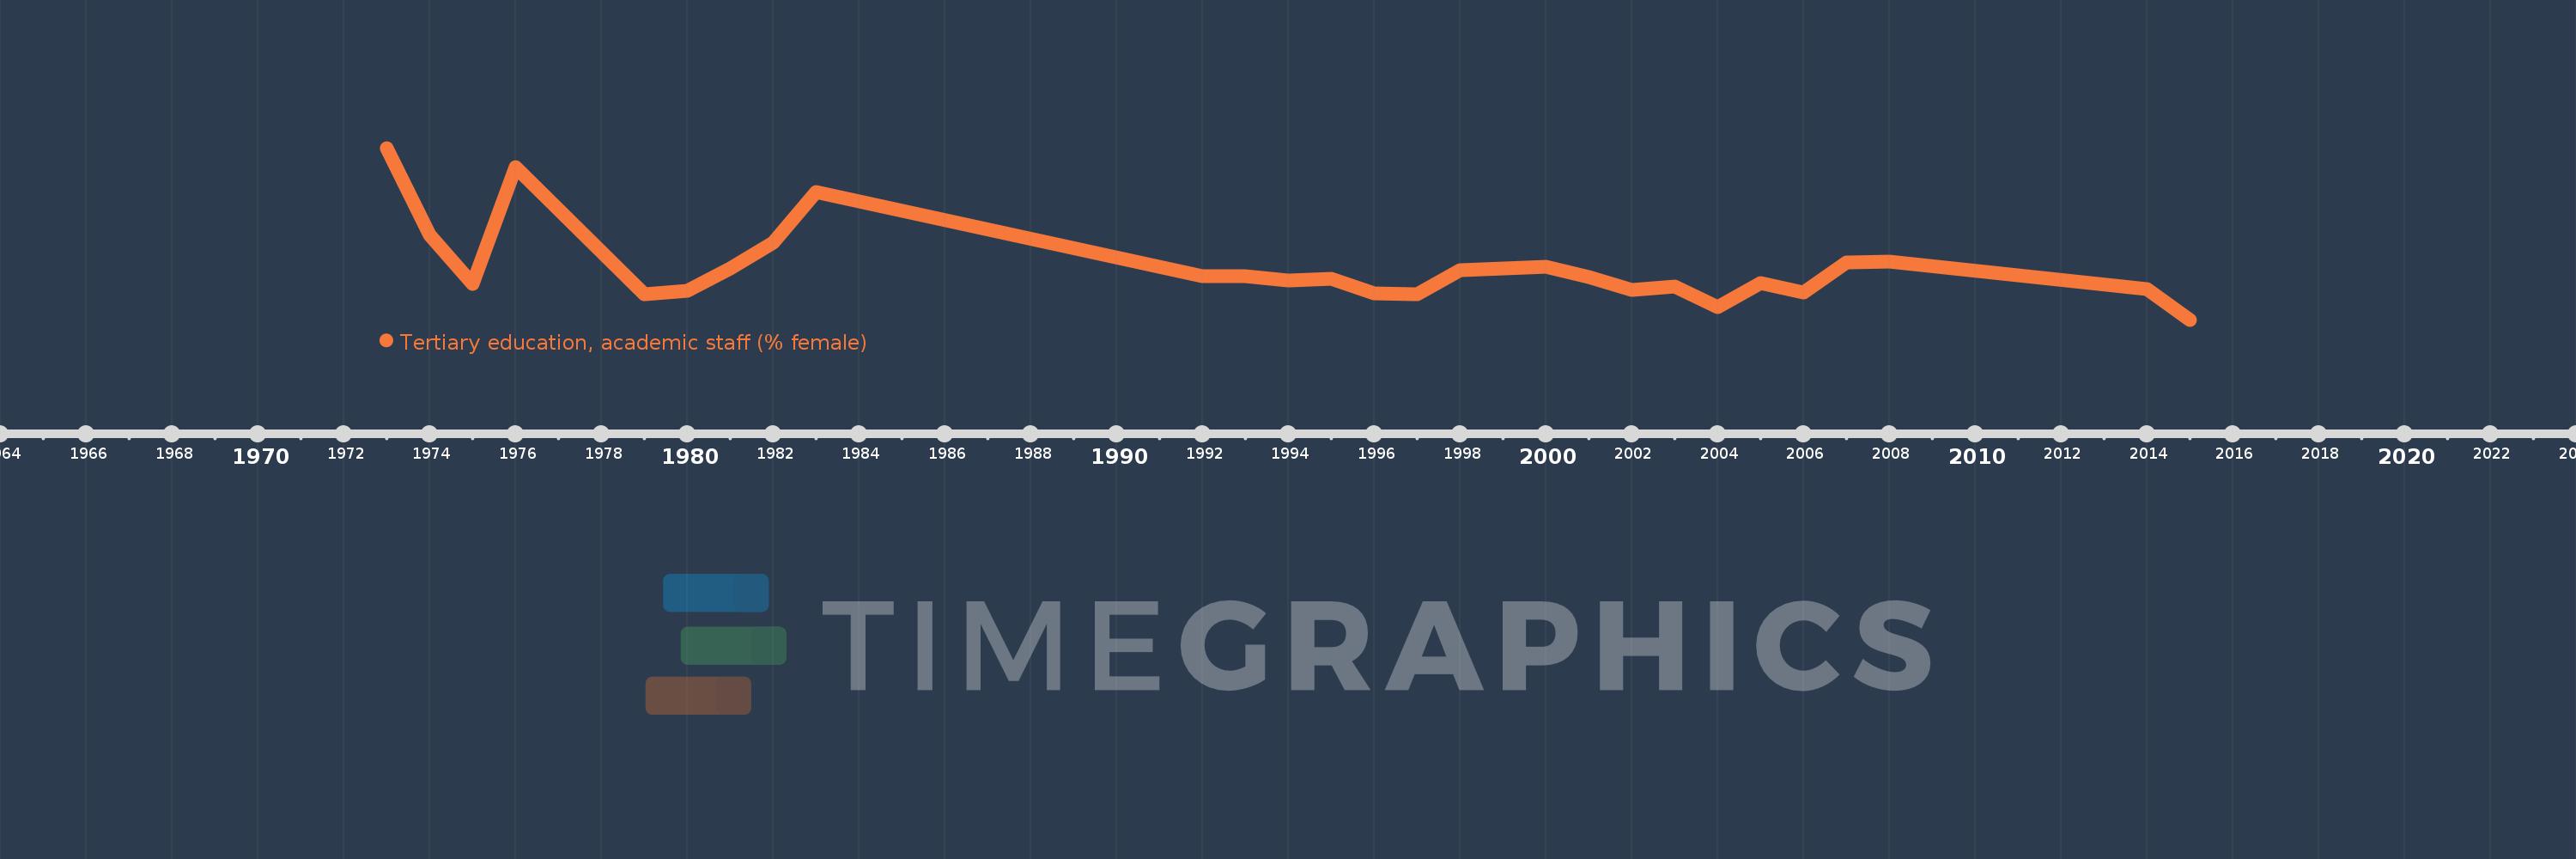
Togo
TGO
true
2
1
Tertiary education, academic staff (% female)
2015,2014,2008,2007,2006,2005,2004,2003,2002,2001,2000,1998,1997,1996,1995,1994,1993,1992,1983,1982,1981,1980,1979,1976,1975,1974,1973