33
/
AIzaSyB4mHJ5NPEv-XzF7P6NDYXjlkCWaeKw5bc
November 30, 2025
214865
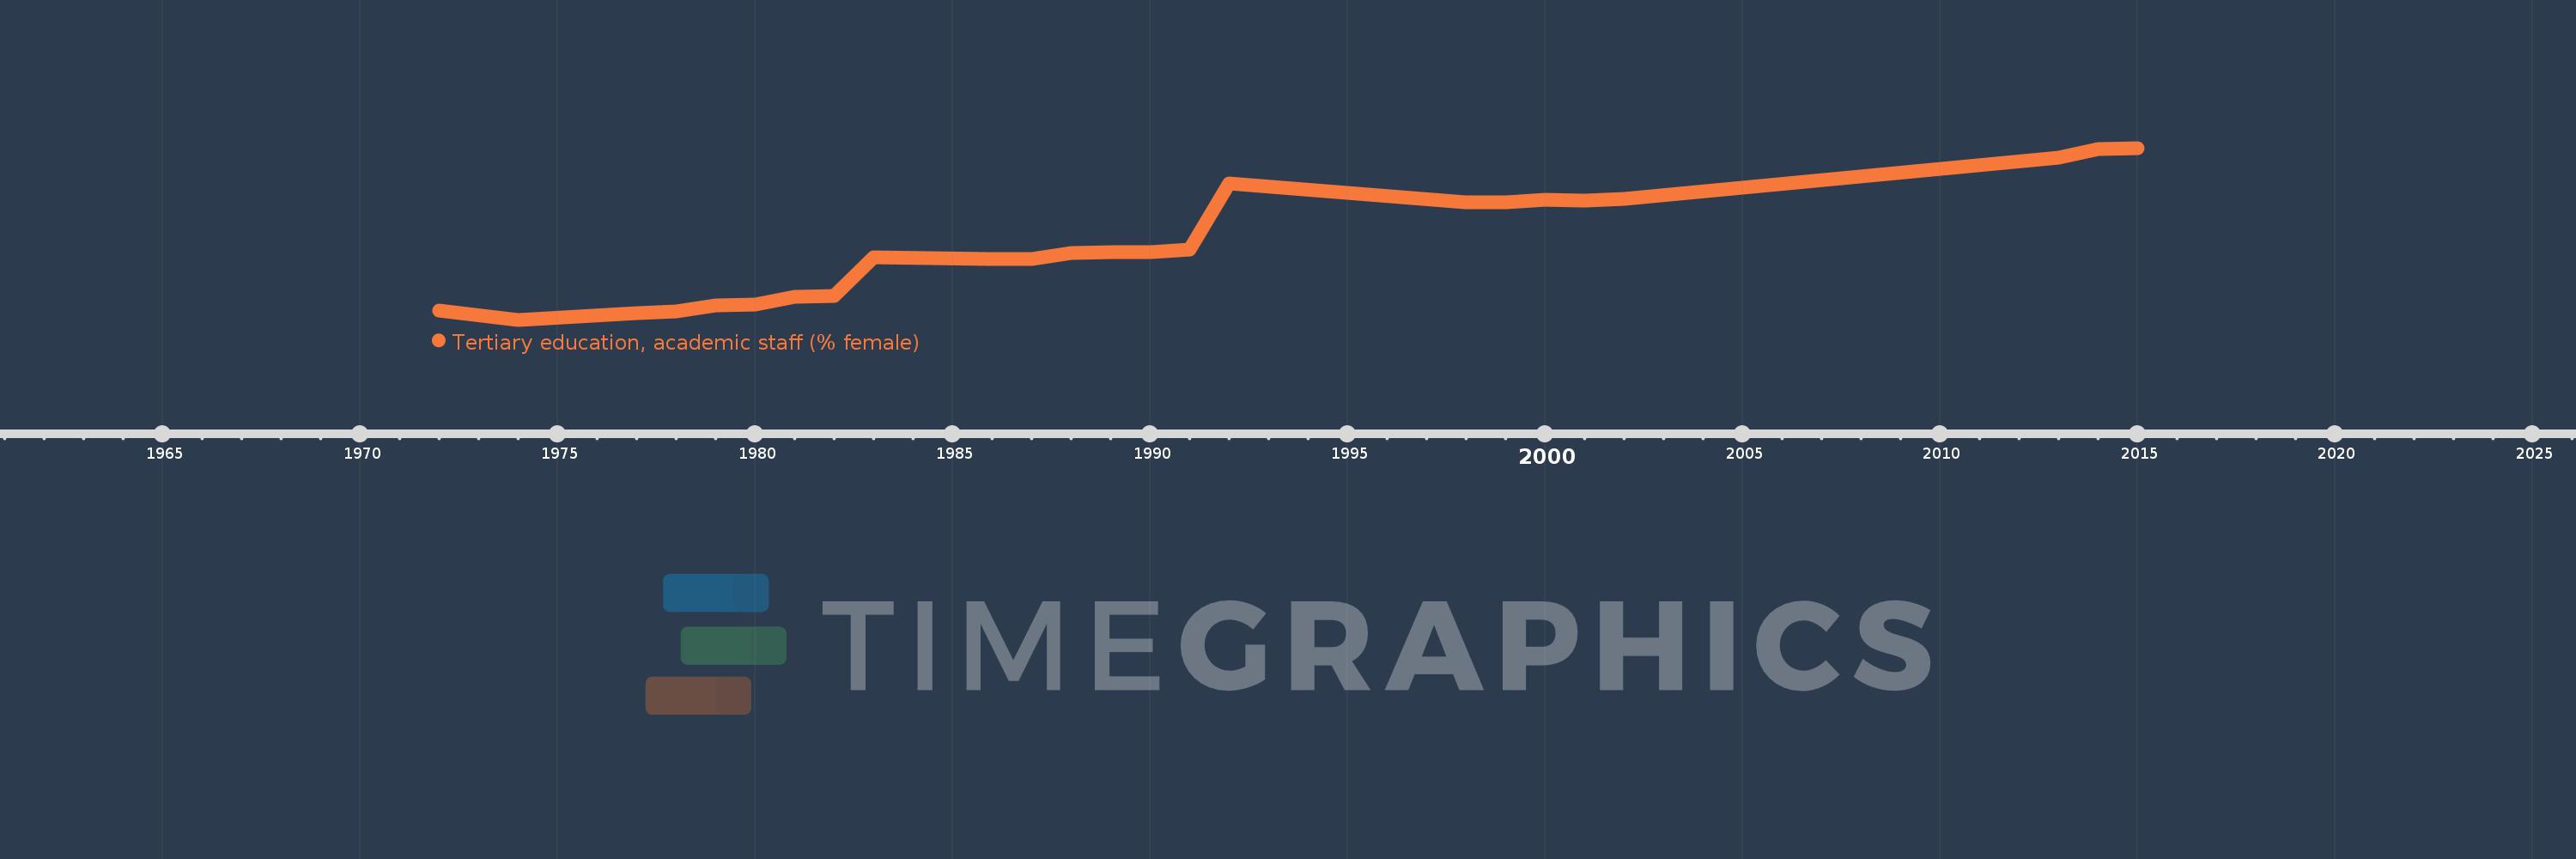
Norway
NOR
true
2
1
Tertiary education, academic staff (% female)
2015,2014,2013,2002,2001,2000,1999,1998,1992,1991,1990,1989,1988,1987,1986,1983,1982,1981,1980,1979,1978,1977,1974,1972