33
/
AIzaSyB4mHJ5NPEv-XzF7P6NDYXjlkCWaeKw5bc
November 30, 2025
255804
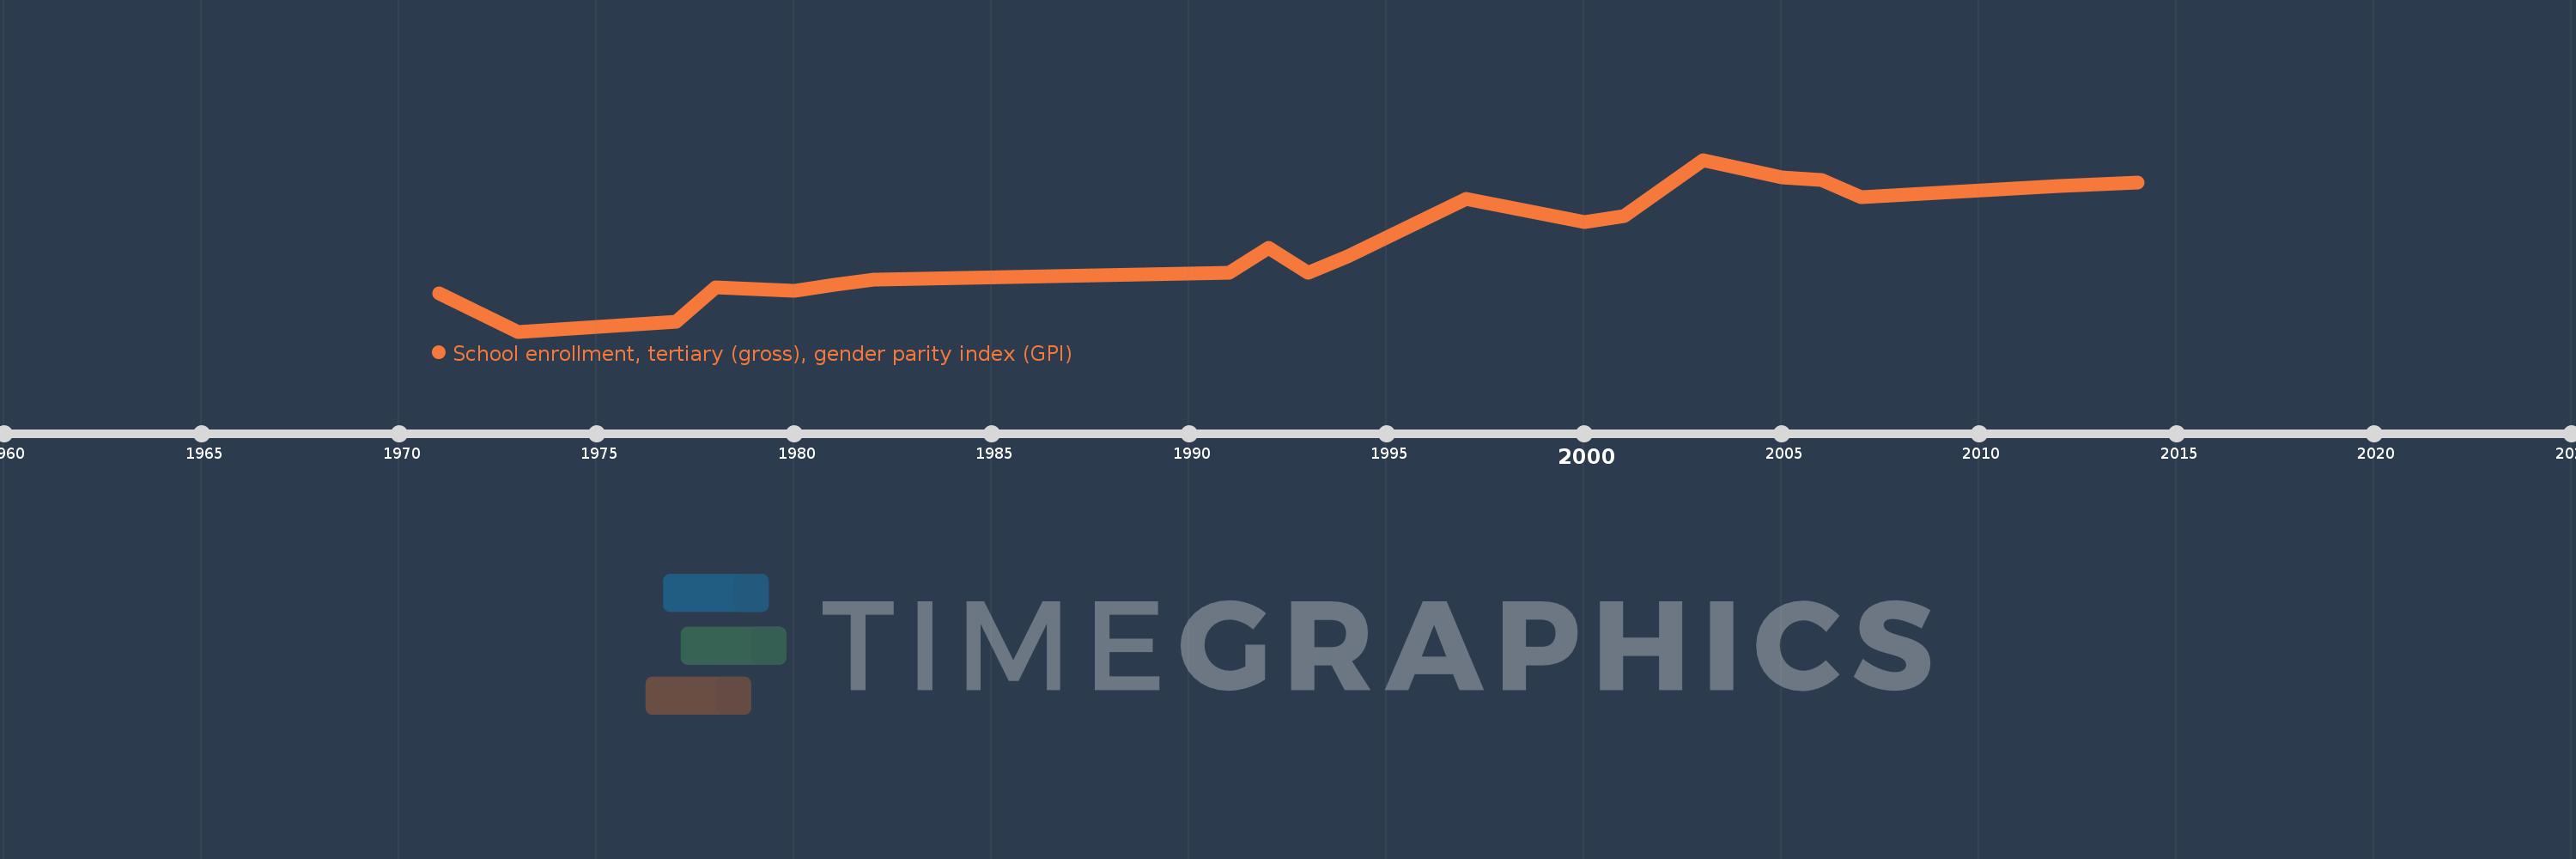
Swaziland
SWZ
true
2
1
School enrollment, tertiary (gross), gender parity index (GPI)
2014,2012,2007,2006,2005,2003,2001,2000,1997,1994,1993,1992,1991,1982,1981,1980,1978,1977,1973,1971