33
/
AIzaSyB4mHJ5NPEv-XzF7P6NDYXjlkCWaeKw5bc
November 30, 2025
104227
Chad
TCD
true
2
1
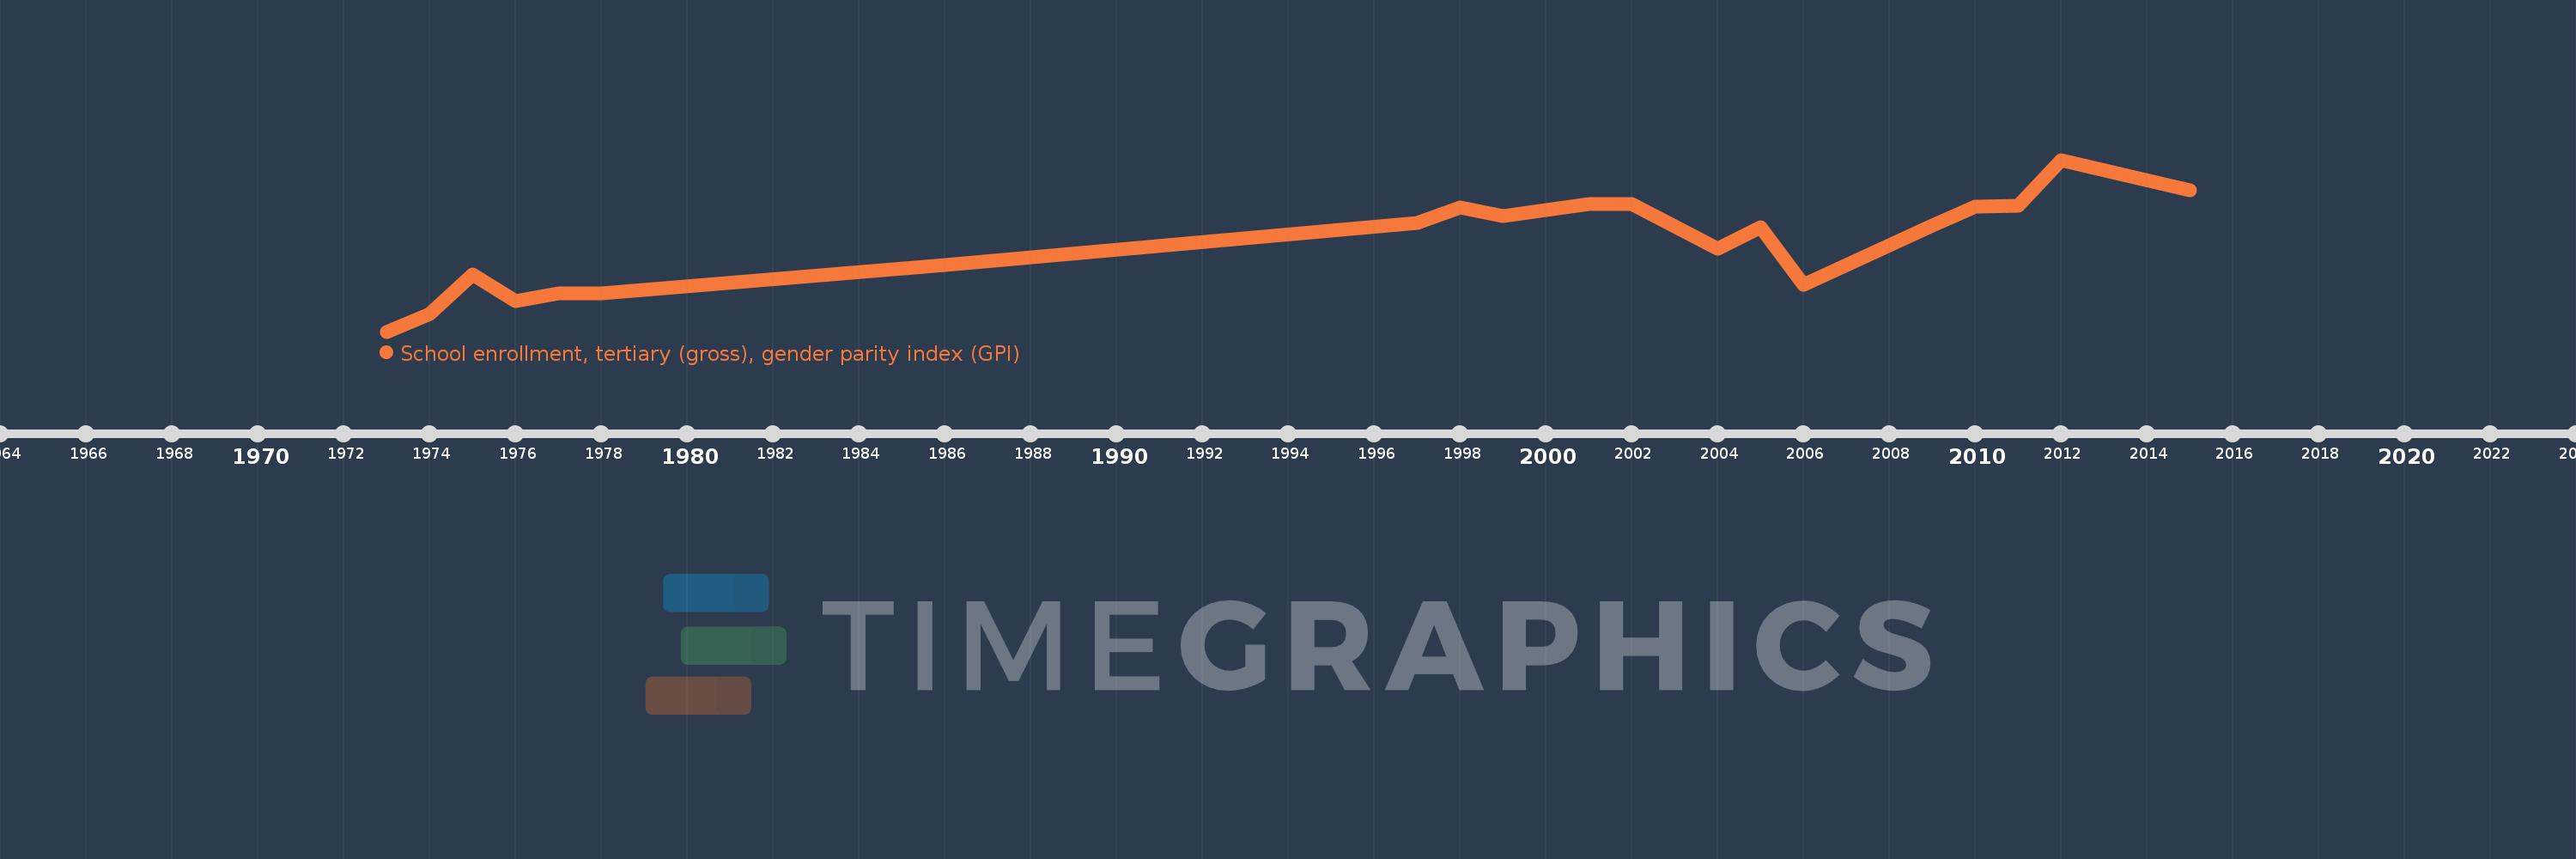
School enrollment, tertiary (gross), gender parity index (GPI)
2015,2012,2011,2010,2009,2006,2005,2004,2002,2001,1999,1998,1997,1986,1978,1977,1976,1975,1974,1973