33
/
AIzaSyB4mHJ5NPEv-XzF7P6NDYXjlkCWaeKw5bc
November 1, 2025
255254
Swaziland
SWZ
true
2
1
Gross savings (current US$)
2015,2014,2013,2012,2011,2010,2009,2008,2007,2006,2005,2004,2003,2002,2001,2000,1999,1998,1997,1996,1995,1994,1993,1992,1991,1975
Create a timeline
Public Timelines
For education
For educational institutions
For teachers
For students
Cabinet
For educational institutions
For teachers
For students
Open cabinet
FAQ
Get premium
Close
Create a timeline
Public timelines
FAQ
About & Feedback
Terms
Privacy
FAQ
Support 24/7
Cabinet
Get premium
Donate
Download
Global statistics library
→
Swaziland
→
Gross savings (current US$)
This statistics in other country:
Afghanistan
Albania
Algeria
Angola
Antigua and Barbuda
Argentina
Armenia
Australia
Austria
Azerbaijan
Bahamas, The
Bahrain
Bangladesh
Barbados
Belarus
Belgium
Belize
Benin
Bermuda
Bhutan
Bolivia
Bosnia and Herzegovina
Botswana
Brazil
Brunei Darussalam
Bulgaria
Burkina Faso
Burundi
Cabo Verde
Cambodia
Cameroon
Canada
Central African Republic
Chad
Chile
China
Colombia
Comoros
Congo, Dem. Rep.
Congo, Rep.
Costa Rica
Cote d'Ivoire
Croatia
Cyprus
Czech Republic
Denmark
Djibouti
Dominica
Dominican Republic
Ecuador
Egypt, Arab Rep.
El Salvador
Equatorial Guinea
Eritrea
Estonia
Ethiopia
Faroe Islands
Fiji
Finland
France
Gabon
Gambia, The
Georgia
Germany
Ghana
Greece
Grenada
Guatemala
Guinea
Guinea-Bissau
Guyana
Haiti
Honduras
Hong Kong SAR, China
Hungary
Iceland
India
Indonesia
Iran, Islamic Rep.
Iraq
Ireland
Israel
Italy
Jamaica
Japan
Jordan
Kazakhstan
Kenya
Kiribati
Korea, Rep.
Kosovo
Kuwait
Kyrgyz Republic
Lao PDR
Latvia
Lebanon
Lesotho
Liberia
Libya
Lithuania
Luxembourg
Macao SAR, China
Macedonia, FYR
Madagascar
Malawi
Malaysia
Maldives
Mali
Malta
Mauritania
Mauritius
Mexico
Moldova
Mongolia
Montenegro
Morocco
Mozambique
Namibia
Nepal
Netherlands
New Zealand
Nicaragua
Niger
Nigeria
Norway
Oman
Pakistan
Panama
Papua New Guinea
Paraguay
Peru
Philippines
Poland
Portugal
Qatar
Romania
Russian Federation
Rwanda
Saudi Arabia
Senegal
Serbia
Seychelles
Sierra Leone
Singapore
Slovak Republic
Slovenia
Solomon Islands
South Africa
South Sudan
Spain
Sri Lanka
St. Kitts and Nevis
St. Lucia
St. Vincent and the Grenadines
Sudan
Suriname
Swaziland
Sweden
Switzerland
Syrian Arab Republic
Tajikistan
Tanzania
Thailand
Timor-Leste
Togo
Tonga
Trinidad and Tobago
Tunisia
Turkey
Uganda
Ukraine
United Kingdom
United States
Uruguay
Vanuatu
Venezuela, RB
Vietnam
West Bank and Gaza
Yemen, Rep.
Zambia
Zimbabwe
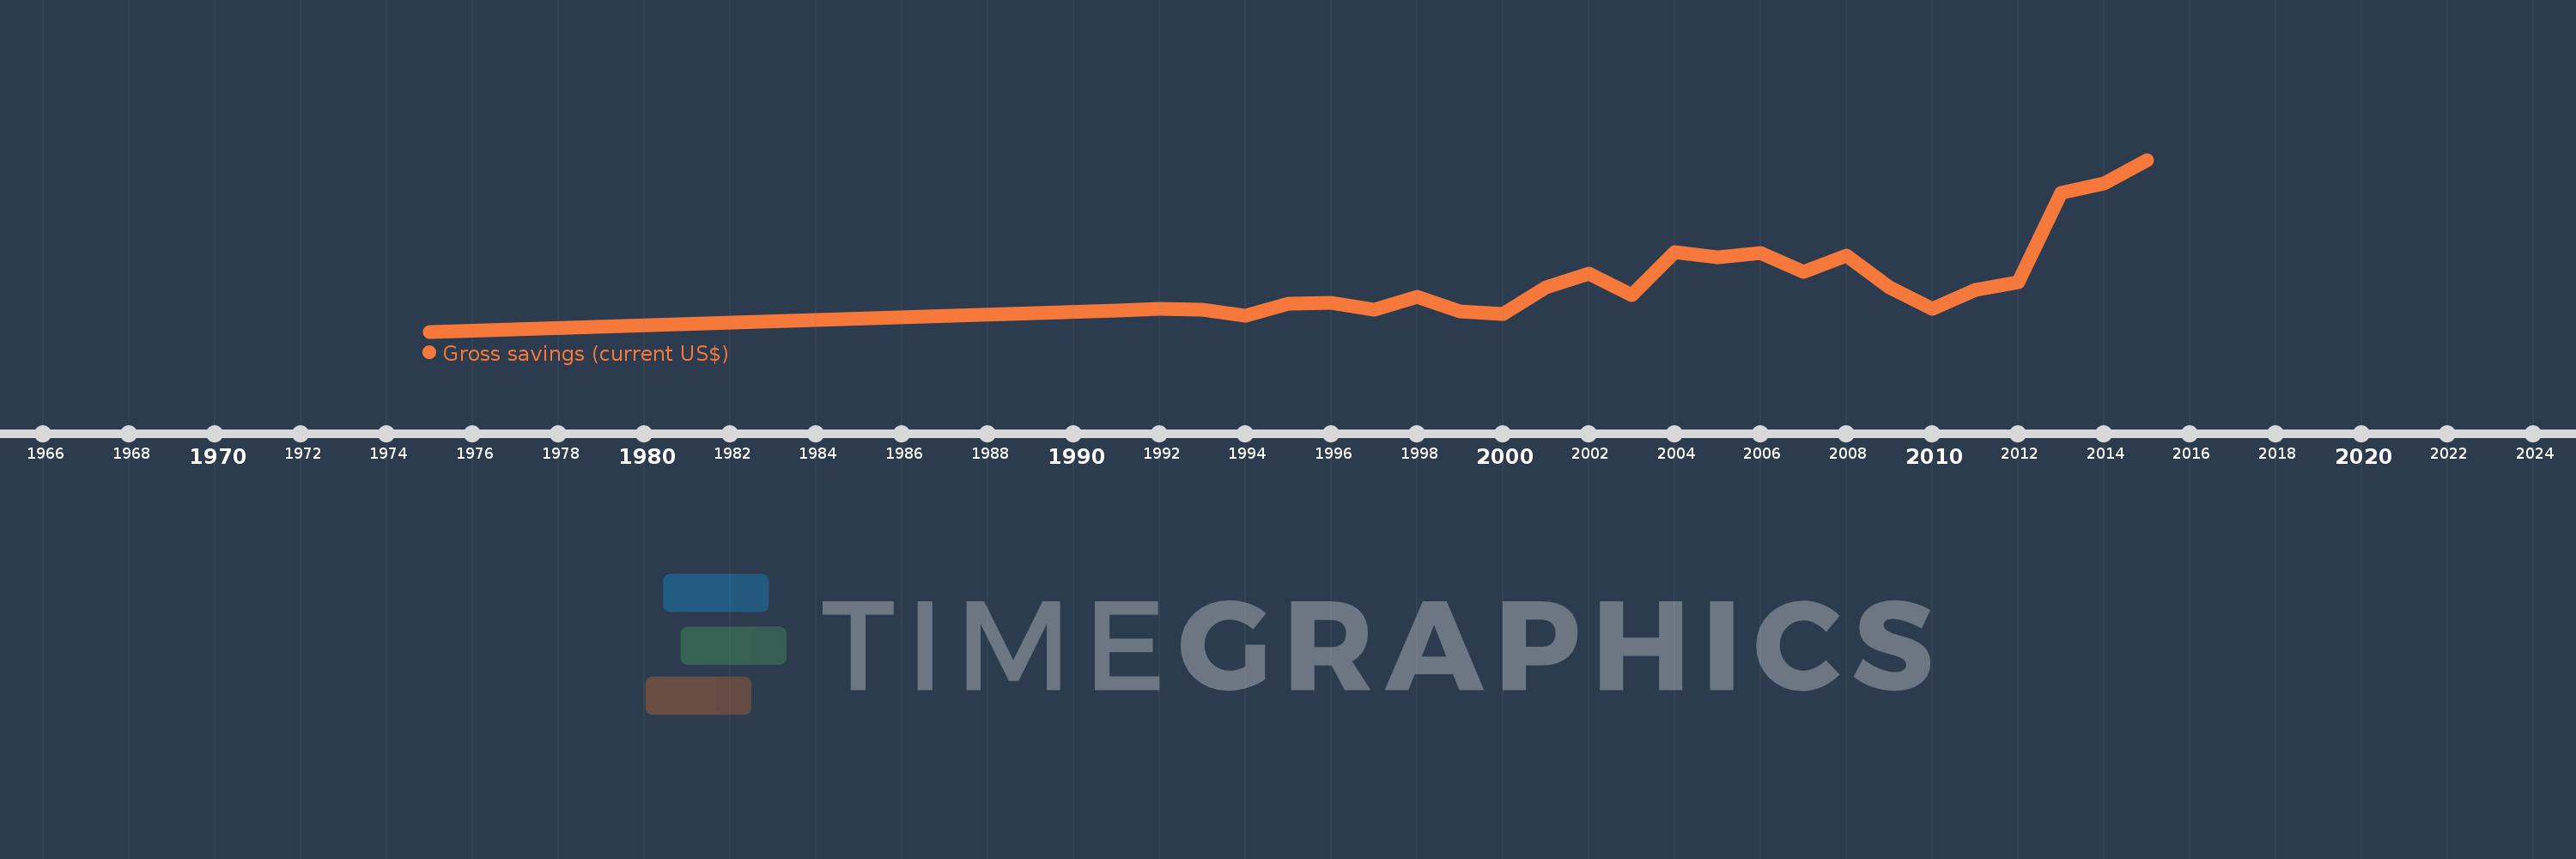
Timeline:
This timeline shows a graph from
1975
to
2015
of Swaziland. No data until
1974
. Number of actual observations by date:
26
.
Source name:
World Development Indicators
Source organization:
World Bank national accounts data, and OECD National Accounts data files.
Categories, topics:
Economy & Growth
Last updated:
apr 23, 2017
Indicators value changes by year
Meaning:
390.8 mln
Minimum:
103.305 mln
jan 1, 1975
Maximum:
1.049 bln
jan 1, 2015
At the date of observation
Value
Absolute change
Change from the previous value
jan 1, 1975
103.305 mln
+103.305 mln
0.0%
jan 1, 1991
219.205 mln
+115.9 mln
112.19%
jan 1, 1992
228.075 mln
+8.87 mln
4.05%
jan 1, 1993
223.177 mln
-4.898 mln
-2.15%
jan 1, 1994
189.738 mln
-33.439 mln
-14.98%
jan 1, 1995
256.902 mln
+67.165 mln
35.4%
jan 1, 1996
263.426 mln
+6.524 mln
2.54%
jan 1, 1997
223.844 mln
-39.581 mln
-15.03%
jan 1, 1998
295.895 mln
+72.051 mln
32.19%
jan 1, 1999
213.036 mln
-82.859 mln
-28.0%
jan 1, 2000
201.417 mln
-11.619 mln
-5.45%
jan 1, 2001
345.987 mln
+144.569 mln
71.78%
jan 1, 2002
422.285 mln
+76.298 mln
22.05%
jan 1, 2003
306.571 mln
-115.714 mln
-27.4%
jan 1, 2004
541.941 mln
+235.37 mln
76.78%
jan 1, 2005
512.794 mln
-29.147 mln
-5.38%
jan 1, 2006
536.265 mln
+23.471 mln
4.58%
jan 1, 2007
434.115 mln
-102.151 mln
-19.05%
jan 1, 2008
521.248 mln
+87.134 mln
20.07%
jan 1, 2009
347.315 mln
-173.933 mln
-33.37%
jan 1, 2010
230.866 mln
-116.449 mln
-33.53%
jan 1, 2011
330.926 mln
+100.06 mln
43.34%
jan 1, 2012
373.277 mln
+42.351 mln
12.8%
jan 1, 2013
868.047 mln
+494.771 mln
132.55%
jan 1, 2014
921.674 mln
+53.626 mln
6.18%
jan 1, 2015
1.049 bln
+127.784 mln
13.86%
Ranking of countries by current statistics by years
About & Feedback
Terms
Privacy
FAQ
Support 24/7
Cabinet
Get premium
Donate
The service accepts bank transfer (ACH, Wire) or cards (Visa, MasterCard, etc). Processed by Stripe.
Secured with SSL