33
/
AIzaSyB4mHJ5NPEv-XzF7P6NDYXjlkCWaeKw5bc
November 30, 2025
181175
Lithuania
LTU
true
2
1
Gross savings (current US$)
2016,2015,2014,2013,2012,2011,2010,2009,2008,2007,2006,2005
Create a timeline
Public Timelines
For education
For educational institutions
For teachers
For students
Cabinet
For educational institutions
For teachers
For students
Open cabinet
FAQ
Close
Create a timeline
Public timelines
FAQ
About & Feedback
Terms
Privacy
FAQ
Support 24/7
Cabinet
Get premium
Donate
Download
Global statistics library
→
Lithuania
→
Gross savings (current US$)
This statistics in other country:
Afghanistan
Albania
Algeria
Angola
Antigua and Barbuda
Argentina
Armenia
Australia
Austria
Azerbaijan
Bahamas, The
Bahrain
Bangladesh
Barbados
Belarus
Belgium
Belize
Benin
Bermuda
Bhutan
Bolivia
Bosnia and Herzegovina
Botswana
Brazil
Brunei Darussalam
Bulgaria
Burkina Faso
Burundi
Cabo Verde
Cambodia
Cameroon
Canada
Central African Republic
Chad
Chile
China
Colombia
Comoros
Congo, Dem. Rep.
Congo, Rep.
Costa Rica
Cote d'Ivoire
Croatia
Cyprus
Czech Republic
Denmark
Djibouti
Dominica
Dominican Republic
Ecuador
Egypt, Arab Rep.
El Salvador
Equatorial Guinea
Eritrea
Estonia
Ethiopia
Faroe Islands
Fiji
Finland
France
Gabon
Gambia, The
Georgia
Germany
Ghana
Greece
Grenada
Guatemala
Guinea
Guinea-Bissau
Guyana
Haiti
Honduras
Hong Kong SAR, China
Hungary
Iceland
India
Indonesia
Iran, Islamic Rep.
Iraq
Ireland
Israel
Italy
Jamaica
Japan
Jordan
Kazakhstan
Kenya
Kiribati
Korea, Rep.
Kosovo
Kuwait
Kyrgyz Republic
Lao PDR
Latvia
Lebanon
Lesotho
Liberia
Libya
Lithuania
Luxembourg
Macao SAR, China
Macedonia, FYR
Madagascar
Malawi
Malaysia
Maldives
Mali
Malta
Mauritania
Mauritius
Mexico
Moldova
Mongolia
Montenegro
Morocco
Mozambique
Namibia
Nepal
Netherlands
New Zealand
Nicaragua
Niger
Nigeria
Norway
Oman
Pakistan
Panama
Papua New Guinea
Paraguay
Peru
Philippines
Poland
Portugal
Qatar
Romania
Russian Federation
Rwanda
Saudi Arabia
Senegal
Serbia
Seychelles
Sierra Leone
Singapore
Slovak Republic
Slovenia
Solomon Islands
South Africa
South Sudan
Spain
Sri Lanka
St. Kitts and Nevis
St. Lucia
St. Vincent and the Grenadines
Sudan
Suriname
Swaziland
Sweden
Switzerland
Syrian Arab Republic
Tajikistan
Tanzania
Thailand
Timor-Leste
Togo
Tonga
Trinidad and Tobago
Tunisia
Turkey
Uganda
Ukraine
United Kingdom
United States
Uruguay
Vanuatu
Venezuela, RB
Vietnam
West Bank and Gaza
Yemen, Rep.
Zambia
Zimbabwe
Timeline:
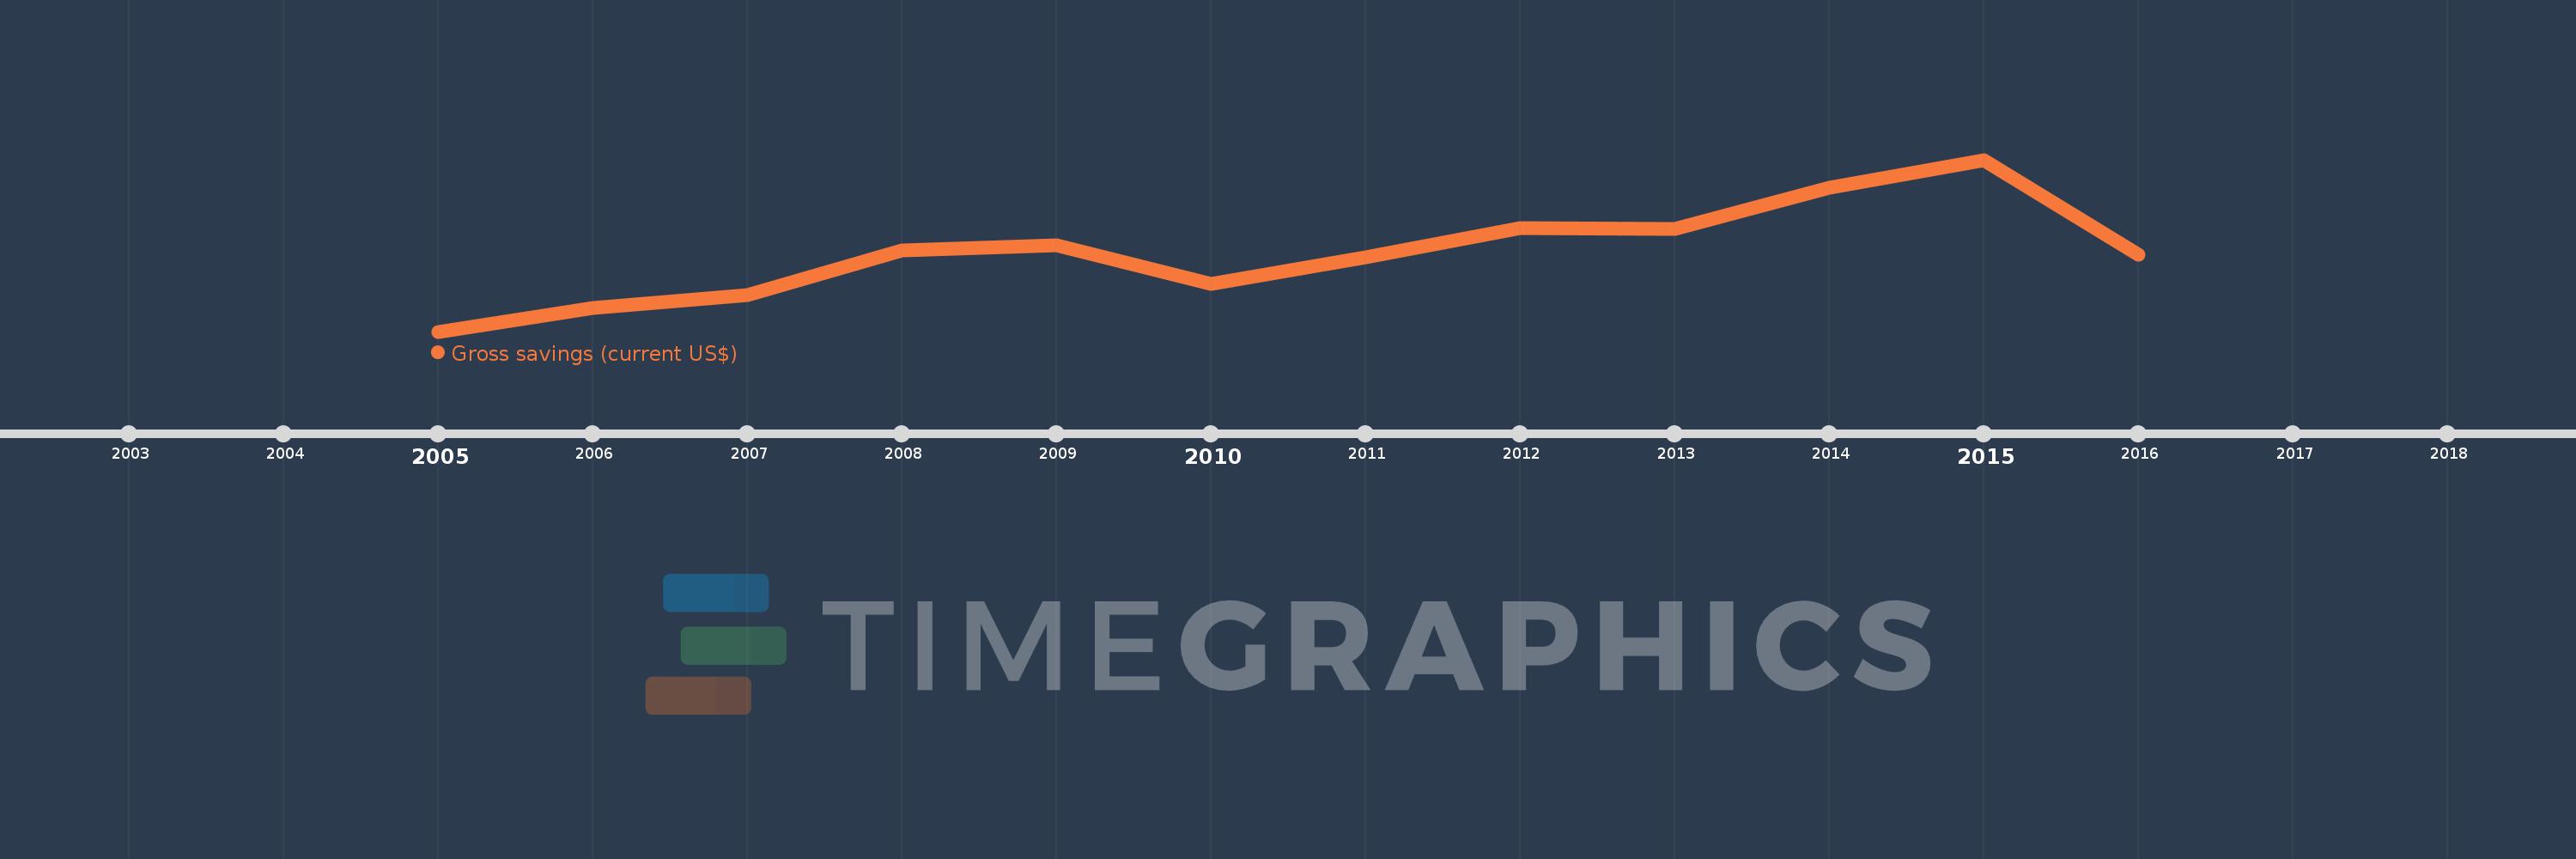
This timeline shows a graph from
2005
to
2016
of Lithuania. No data until
2004
. Number of actual observations by date:
12
.
Source name:
World Development Indicators
Source organization:
World Bank national accounts data, and OECD National Accounts data files.
Categories, topics:
Economy & Growth
Last updated:
apr 23, 2017
Indicators value changes by year
Meaning:
6.825 bln
Minimum:
3.523 bln
jan 1, 2005
Maximum:
10.706 bln
jan 1, 2015
At the date of observation
Value
Absolute change
Change from the previous value
jan 1, 2005
3.523 bln
+3.523 bln
0.0%
jan 1, 2006
4.499 bln
+975.726 mln
27.7%
jan 1, 2007
5.054 bln
+555.114 mln
12.34%
jan 1, 2008
6.901 bln
+1.847 bln
36.55%
jan 1, 2009
7.129 bln
+227.731 mln
3.3%
jan 1, 2010
5.508 bln
-1.621 bln
-22.74%
jan 1, 2011
6.64 bln
+1.132 bln
20.55%
jan 1, 2012
7.862 bln
+1.222 bln
18.41%
jan 1, 2013
7.824 bln
-37.912 mln
-0.48%
jan 1, 2014
9.532 bln
+1.708 bln
21.84%
jan 1, 2015
10.706 bln
+1.174 bln
12.32%
jan 1, 2016
6.721 bln
-3.985 bln
-37.22%
Ranking of countries by current statistics by years
About & Feedback
Terms
Privacy
FAQ
Support 24/7
Cabinet
Get premium
Donate
The service accepts bank transfer (ACH, Wire) or cards (Visa, MasterCard, etc). Processed by Stripe.
Secured with SSL