33
/
AIzaSyB4mHJ5NPEv-XzF7P6NDYXjlkCWaeKw5bc
November 30, 2025
251232
St. Lucia
LCA
true
2
1
PPG, bonds (DOD, current US$)
2016,2015,2014,2013,2012,2011,2010,2009,2008,2007,2006,2005,2004,2003,2002,2001
Create a timeline
Public Timelines
For education
For educational institutions
For teachers
For students
Cabinet
For educational institutions
For teachers
For students
Open cabinet
FAQ
Close
Create a timeline
Public timelines
FAQ
About & Feedback
Terms
Privacy
FAQ
Support 24/7
Cabinet
Get premium
Donate
Download
Global statistics library
→
St. Lucia
→
PPG, bonds (DOD, current US$)
This statistics in other country:
Albania
Algeria
Angola
Argentina
Armenia
Azerbaijan
Belarus
Belize
Benin
Bolivia
Bosnia and Herzegovina
Botswana
Brazil
Bulgaria
Burkina Faso
Cameroon
China
Colombia
Congo, Dem. Rep.
Congo, Rep.
Costa Rica
Cote d'Ivoire
Dominica
Dominican Republic
East Asia & Pacific (excluding high income)
Ecuador
Egypt, Arab Rep.
El Salvador
Ethiopia
Europe & Central Asia (excluding high income)
Fiji
Gabon
Georgia
Ghana
Grenada
Guatemala
Guinea
Guyana
Haiti
Honduras
IDA only
India
Indonesia
Jamaica
Jordan
Kazakhstan
Kenya
Lao PDR
Latin America & Caribbean (excluding high income)
Lebanon
Low & middle income
Low income
Lower middle income
Macedonia, FYR
Malawi
Malaysia
Mauritania
Mauritius
Mexico
Middle East & North Africa (excluding high income)
Middle income
Moldova
Mongolia
Montenegro
Morocco
Mozambique
Nicaragua
Niger
Nigeria
Pakistan
Panama
Papua New Guinea
Paraguay
Peru
Philippines
Romania
Russian Federation
Rwanda
Samoa
Senegal
Serbia
Sierra Leone
South Africa
South Asia
Sri Lanka
St. Lucia
St. Vincent and the Grenadines
Sub-Saharan Africa (excluding high income)
Sudan
Thailand
Togo
Tunisia
Turkey
Uganda
Ukraine
Upper middle income
Venezuela, RB
Vietnam
Zambia
Zimbabwe
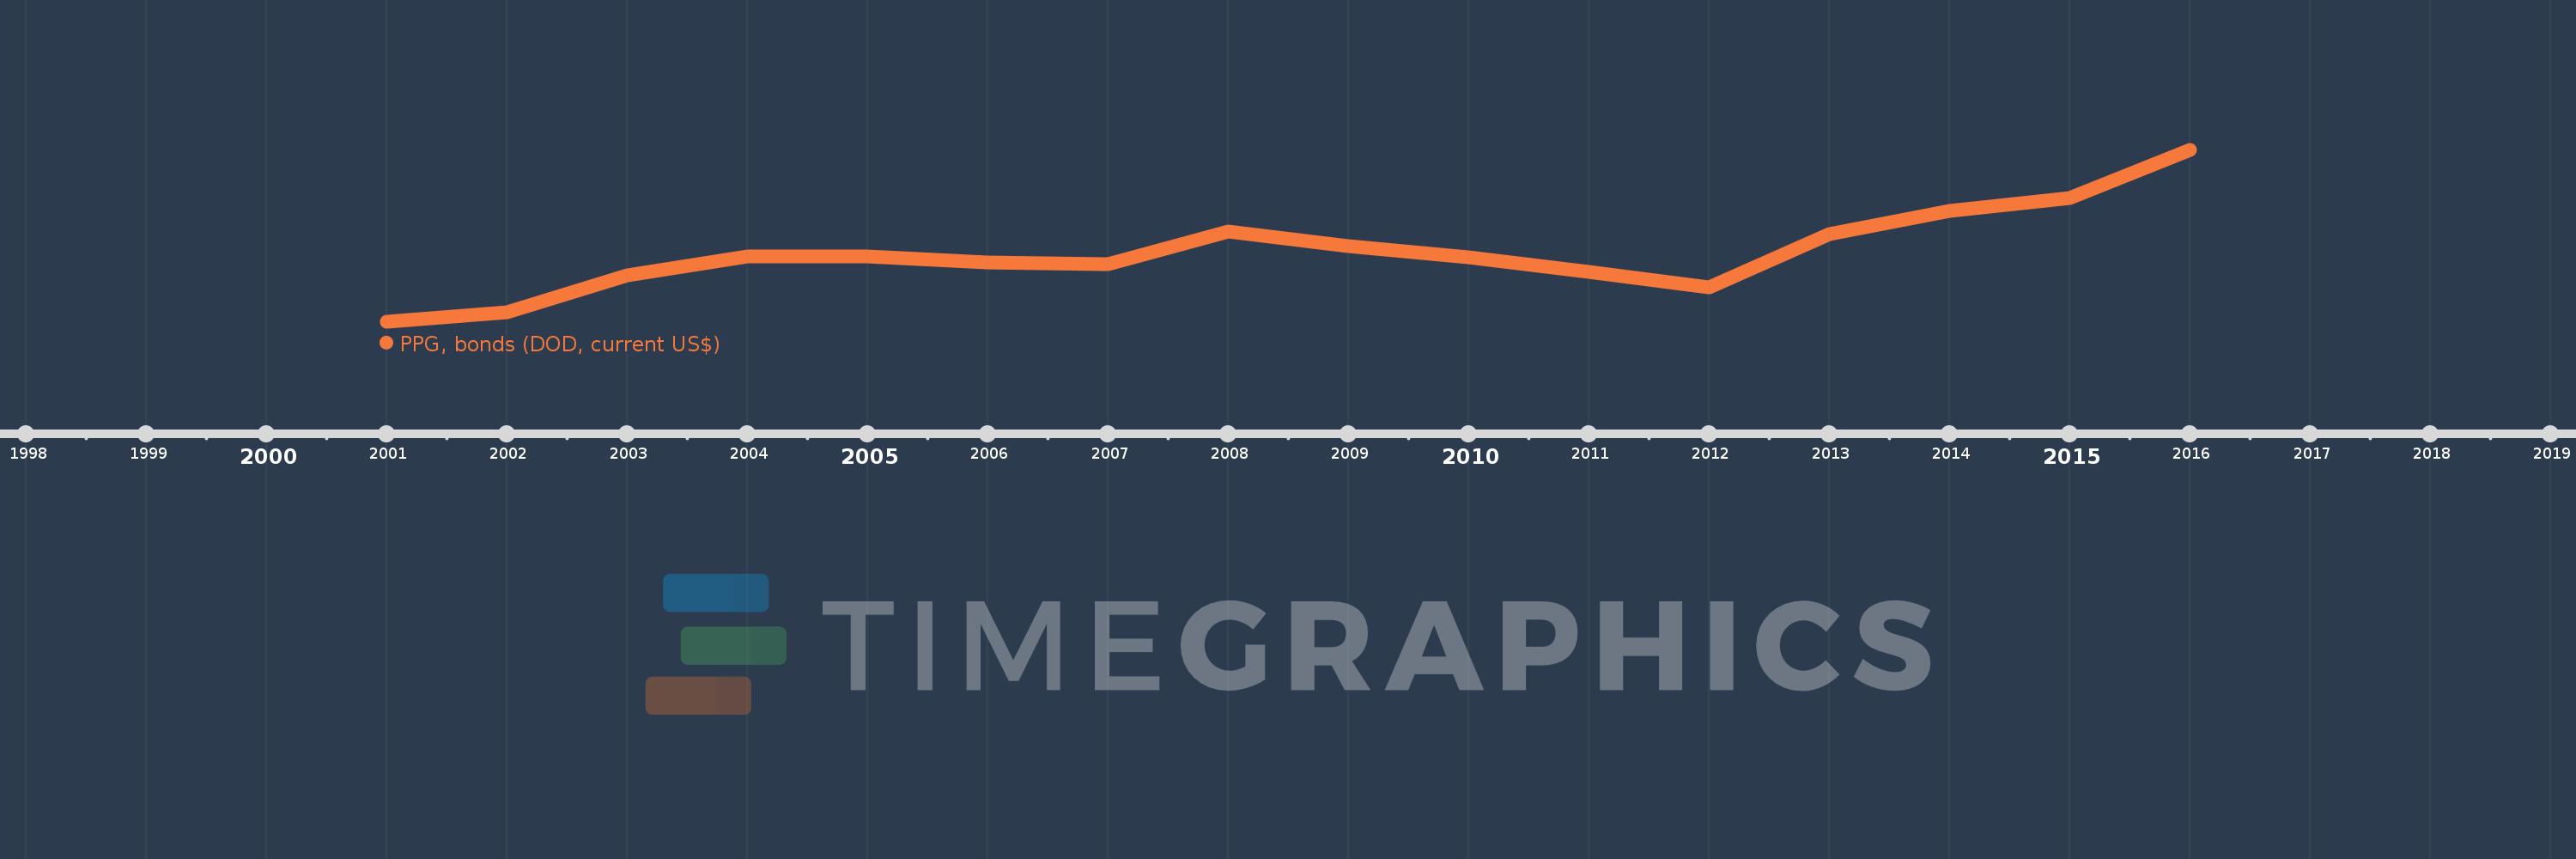
Timeline:
This timeline shows a graph from
2001
to
2016
of St. Lucia. No data until
2000
. Number of actual observations by date:
16
.
Source name:
World Development Indicators
Source organization:
World Bank, International Debt Statistics.
Categories, topics:
External Debt
Last updated:
apr 23, 2017
Indicators value changes by year
Meaning:
78.952 mln
Minimum:
23.519 mln
jan 1, 2001
Maximum:
160.183 mln
jan 1, 2016
At the date of observation
Value
Absolute change
Change from the previous value
jan 1, 2001
23.519 mln
+23.519 mln
0.0%
jan 1, 2002
30.926 mln
+7.407 mln
31.49%
jan 1, 2003
60.926 mln
+30.0 mln
97.01%
jan 1, 2004
75.926 mln
+15.0 mln
24.62%
jan 1, 2005
75.618 mln
-308.0K
-0.41%
jan 1, 2006
70.938 mln
-4.68 mln
-6.19%
jan 1, 2007
69.348 mln
-1.59 mln
-2.24%
jan 1, 2008
95.528 mln
+26.18 mln
37.75%
jan 1, 2009
83.638 mln
-11.89 mln
-12.45%
jan 1, 2010
75.14 mln
-8.498 mln
-10.16%
jan 1, 2011
63.25 mln
-11.89 mln
-15.82%
jan 1, 2012
51.359 mln
-11.891 mln
-18.8%
jan 1, 2013
93.367 mln
+42.008 mln
81.79%
jan 1, 2014
111.728 mln
+18.361 mln
19.67%
jan 1, 2015
121.834 mln
+10.106 mln
9.05%
jan 1, 2016
160.183 mln
+38.349 mln
31.48%
Ranking of countries by current statistics by years
About & Feedback
Terms
Privacy
FAQ
Support 24/7
Cabinet
Get premium
Donate
The service accepts bank transfer (ACH, Wire) or cards (Visa, MasterCard, etc). Processed by Stripe.
Secured with SSL