33
/
AIzaSyB4mHJ5NPEv-XzF7P6NDYXjlkCWaeKw5bc
November 30, 2025
176919
Lebanon
LBN
true
2
1
PPG, bonds (DOD, current US$)
2016,2015,2014,2013,2012,2011,2010,2009,2008,2007,2006,2005,2004,2003,2002,2001,2000,1999,1998,1997,1996,1995
Create a timeline
Public Timelines
For education
For educational institutions
For teachers
For students
Cabinet
For educational institutions
For teachers
For students
Open cabinet
FAQ
Close
Create a timeline
Public timelines
FAQ
About & Feedback
Terms
Privacy
FAQ
Support 24/7
Cabinet
Get premium
Donate
Download
Global statistics library
→
Lebanon
→
PPG, bonds (DOD, current US$)
This statistics in other country:
Albania
Algeria
Angola
Argentina
Armenia
Azerbaijan
Belarus
Belize
Benin
Bolivia
Bosnia and Herzegovina
Botswana
Brazil
Bulgaria
Burkina Faso
Cameroon
China
Colombia
Congo, Dem. Rep.
Congo, Rep.
Costa Rica
Cote d'Ivoire
Dominica
Dominican Republic
East Asia & Pacific (excluding high income)
Ecuador
Egypt, Arab Rep.
El Salvador
Ethiopia
Europe & Central Asia (excluding high income)
Fiji
Gabon
Georgia
Ghana
Grenada
Guatemala
Guinea
Guyana
Haiti
Honduras
IDA only
India
Indonesia
Jamaica
Jordan
Kazakhstan
Kenya
Lao PDR
Latin America & Caribbean (excluding high income)
Lebanon
Low & middle income
Low income
Lower middle income
Macedonia, FYR
Malawi
Malaysia
Mauritania
Mauritius
Mexico
Middle East & North Africa (excluding high income)
Middle income
Moldova
Mongolia
Montenegro
Morocco
Mozambique
Nicaragua
Niger
Nigeria
Pakistan
Panama
Papua New Guinea
Paraguay
Peru
Philippines
Romania
Russian Federation
Rwanda
Samoa
Senegal
Serbia
Sierra Leone
South Africa
South Asia
Sri Lanka
St. Lucia
St. Vincent and the Grenadines
Sub-Saharan Africa (excluding high income)
Sudan
Thailand
Togo
Tunisia
Turkey
Uganda
Ukraine
Upper middle income
Venezuela, RB
Vietnam
Zambia
Zimbabwe
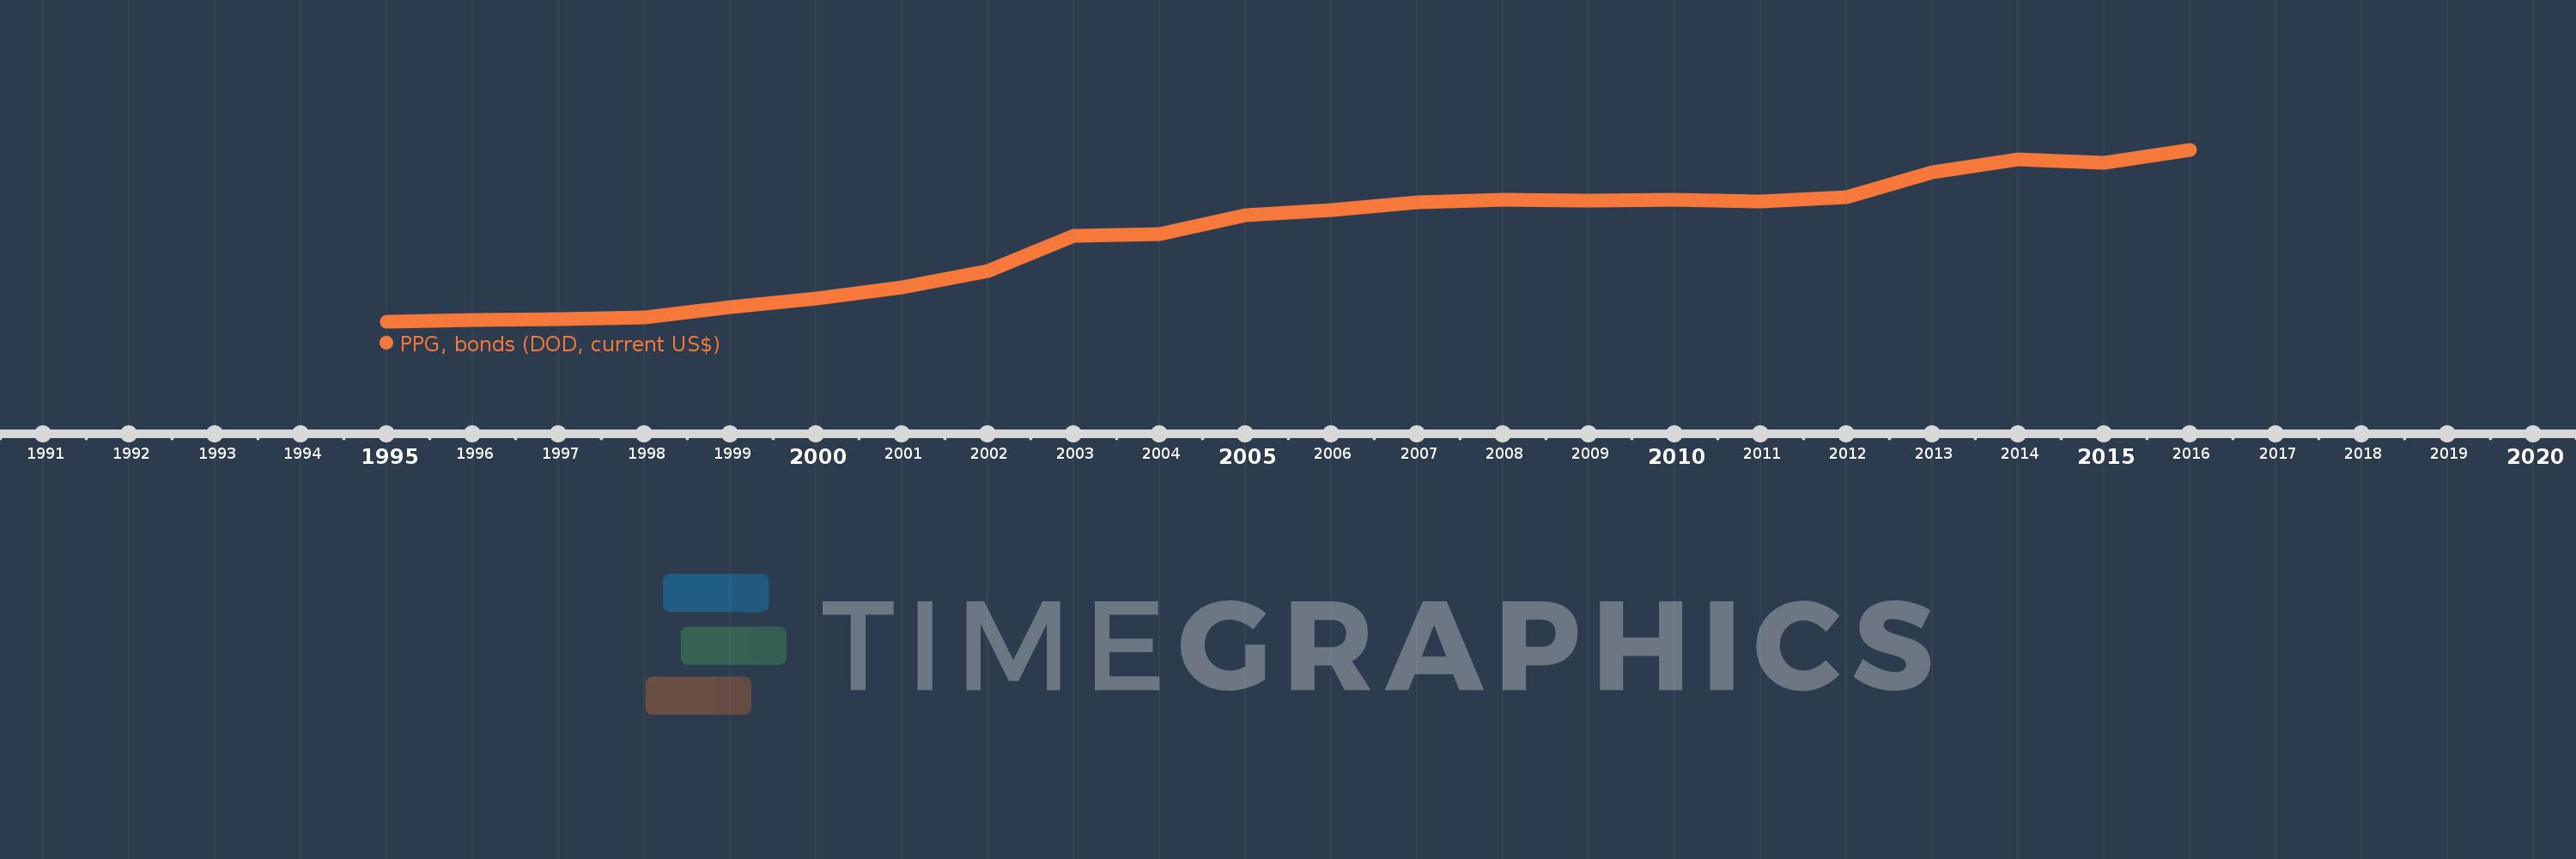
Timeline:
This timeline shows a graph from
1995
to
2016
of Lebanon. No data until
1994
. Number of actual observations by date:
22
.
Source name:
World Development Indicators
Source organization:
World Bank, International Debt Statistics.
Categories, topics:
External Debt
Last updated:
apr 23, 2017
Indicators value changes by year
Meaning:
12.579 bln
Minimum:
400.0 mln
jan 1, 1995
Maximum:
24.645 bln
jan 1, 2016
At the date of observation
Value
Absolute change
Change from the previous value
jan 1, 1995
400.0 mln
+400.0 mln
0.0%
jan 1, 1996
700.0 mln
+300.0 mln
75.0%
jan 1, 1997
800.0 mln
+100.0 mln
14.29%
jan 1, 1998
1.04 bln
+239.501 mln
29.94%
jan 1, 1999
2.499 bln
+1.46 bln
140.45%
jan 1, 2000
3.681 bln
+1.182 bln
47.28%
jan 1, 2001
5.26 bln
+1.579 bln
42.89%
jan 1, 2002
7.612 bln
+2.352 bln
44.71%
jan 1, 2003
12.517 bln
+4.905 bln
64.44%
jan 1, 2004
12.8 bln
+283.273 mln
2.26%
jan 1, 2005
15.453 bln
+2.653 bln
20.72%
jan 1, 2006
16.142 bln
+688.715 mln
4.46%
jan 1, 2007
17.253 bln
+1.111 bln
6.88%
jan 1, 2008
17.707 bln
+454.076 mln
2.63%
jan 1, 2009
17.49 bln
-217.323 mln
-1.23%
jan 1, 2010
17.704 bln
+214.002 mln
1.22%
jan 1, 2011
17.422 bln
-281.671 mln
-1.59%
jan 1, 2012
17.966 bln
+543.995 mln
3.12%
jan 1, 2013
21.489 bln
+3.523 bln
19.61%
jan 1, 2014
23.298 bln
+1.809 bln
8.42%
jan 1, 2015
22.855 bln
-442.69 mln
-1.9%
jan 1, 2016
24.645 bln
+1.79 bln
7.83%
Ranking of countries by current statistics by years
About & Feedback
Terms
Privacy
FAQ
Support 24/7
Cabinet
Get premium
Donate
The service accepts bank transfer (ACH, Wire) or cards (Visa, MasterCard, etc). Processed by Stripe.
Secured with SSL