33
/
AIzaSyB4mHJ5NPEv-XzF7P6NDYXjlkCWaeKw5bc
November 1, 2025
249433
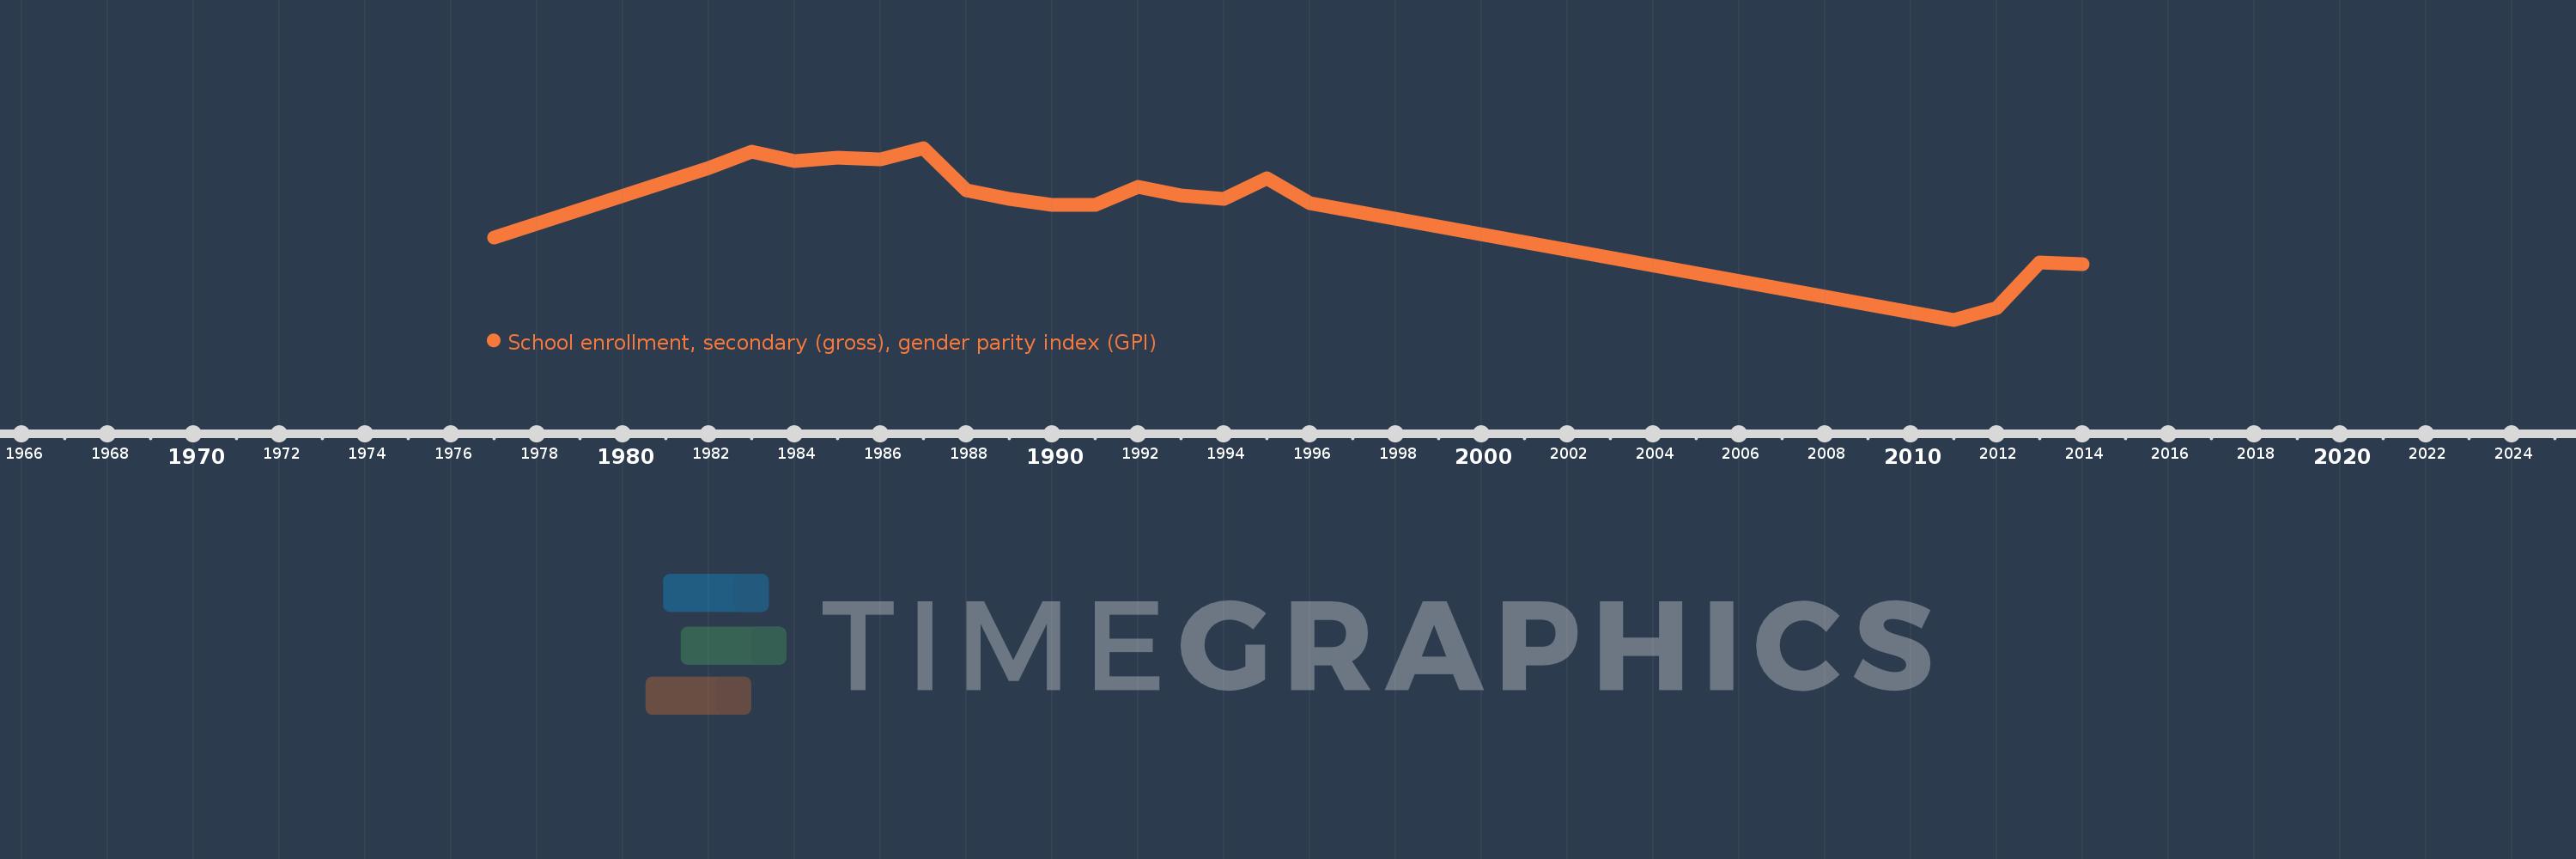
Sri Lanka
LKA
true
2
1
School enrollment, secondary (gross), gender parity index (GPI)
2014,2013,2012,2011,1996,1995,1994,1993,1992,1991,1990,1989,1988,1987,1986,1985,1984,1983,1982,1977