33
/
AIzaSyB4mHJ5NPEv-XzF7P6NDYXjlkCWaeKw5bc
November 30, 2025
199834
Mongolia
MNG
true
2
1
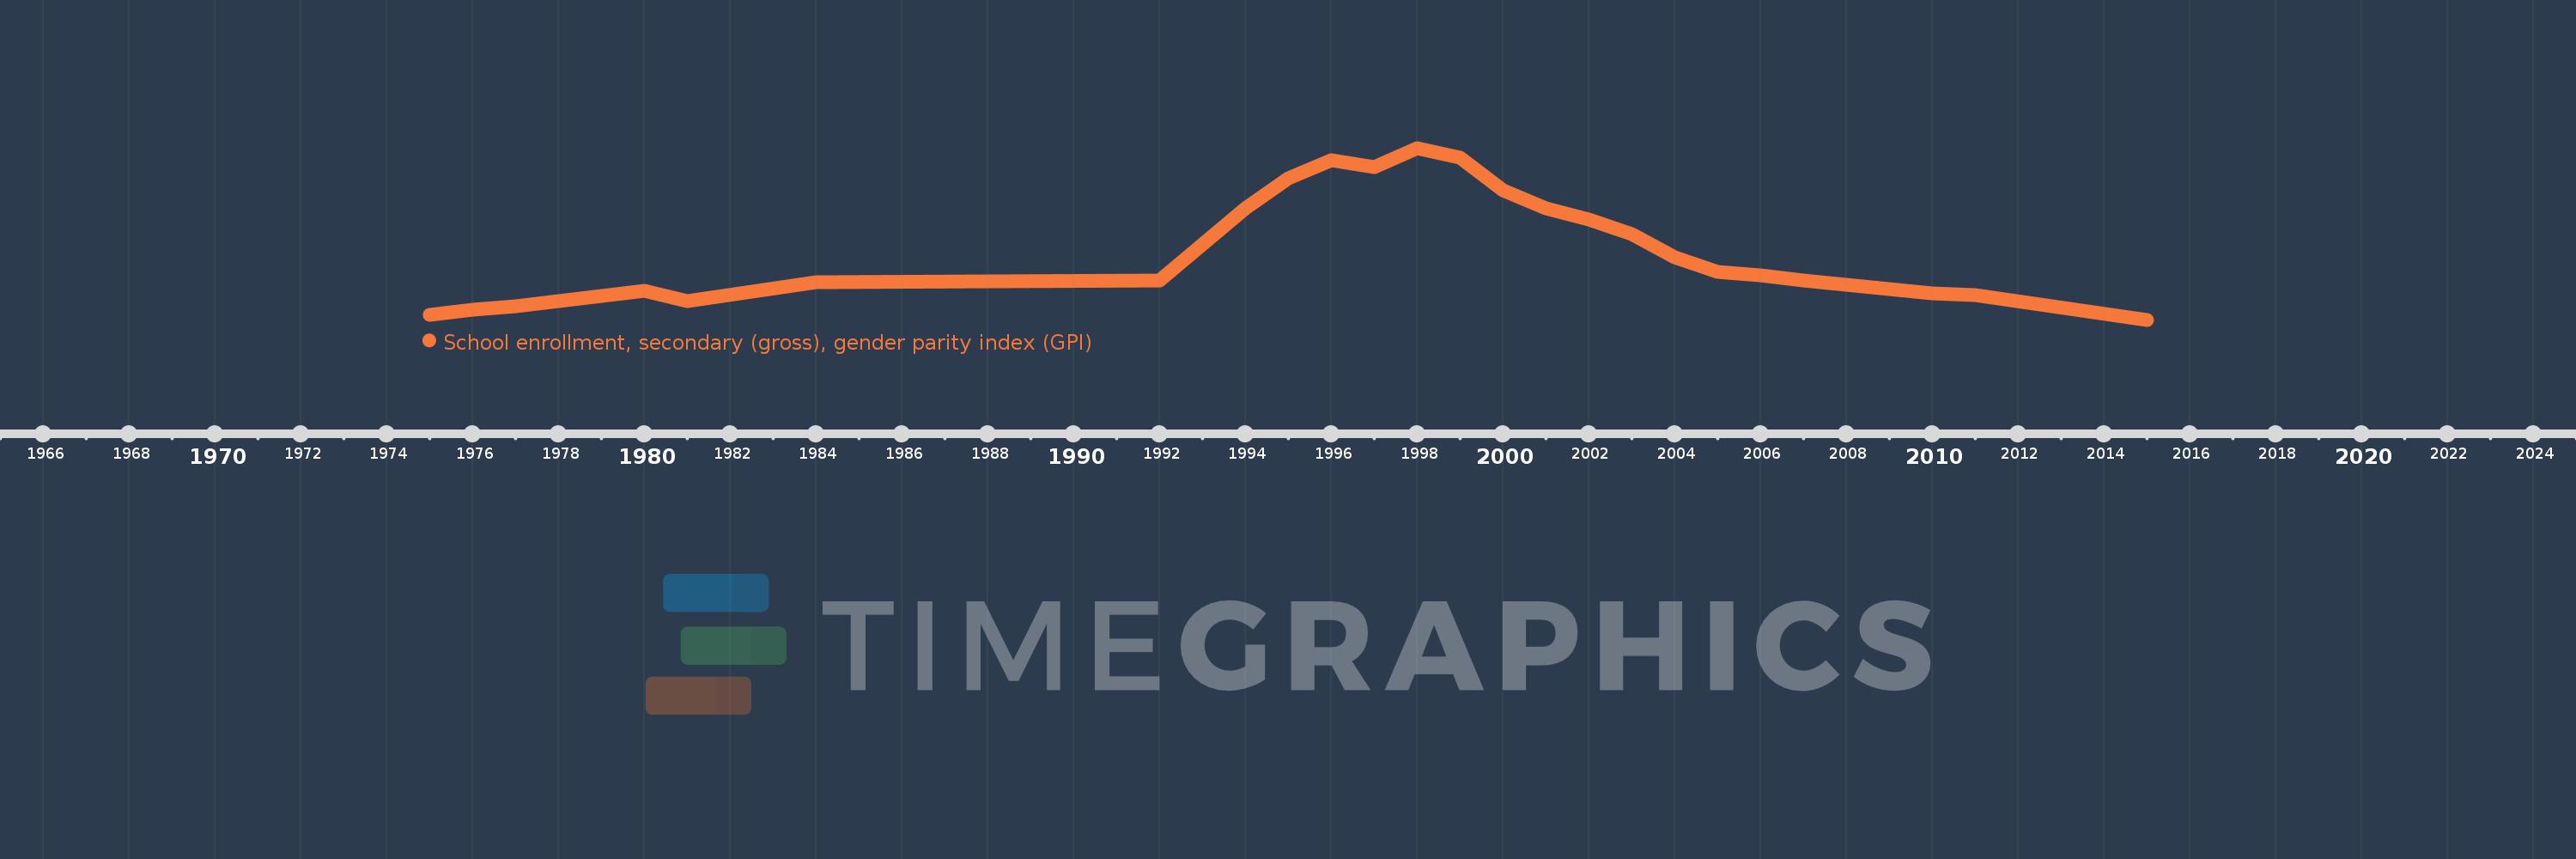
School enrollment, secondary (gross), gender parity index (GPI)
2015,2011,2010,2007,2006,2005,2004,2003,2002,2001,2000,1999,1998,1997,1996,1995,1994,1992,1984,1981,1980,1977,1976,1975