33
/
AIzaSyB4mHJ5NPEv-XzF7P6NDYXjlkCWaeKw5bc
November 30, 2025
248983
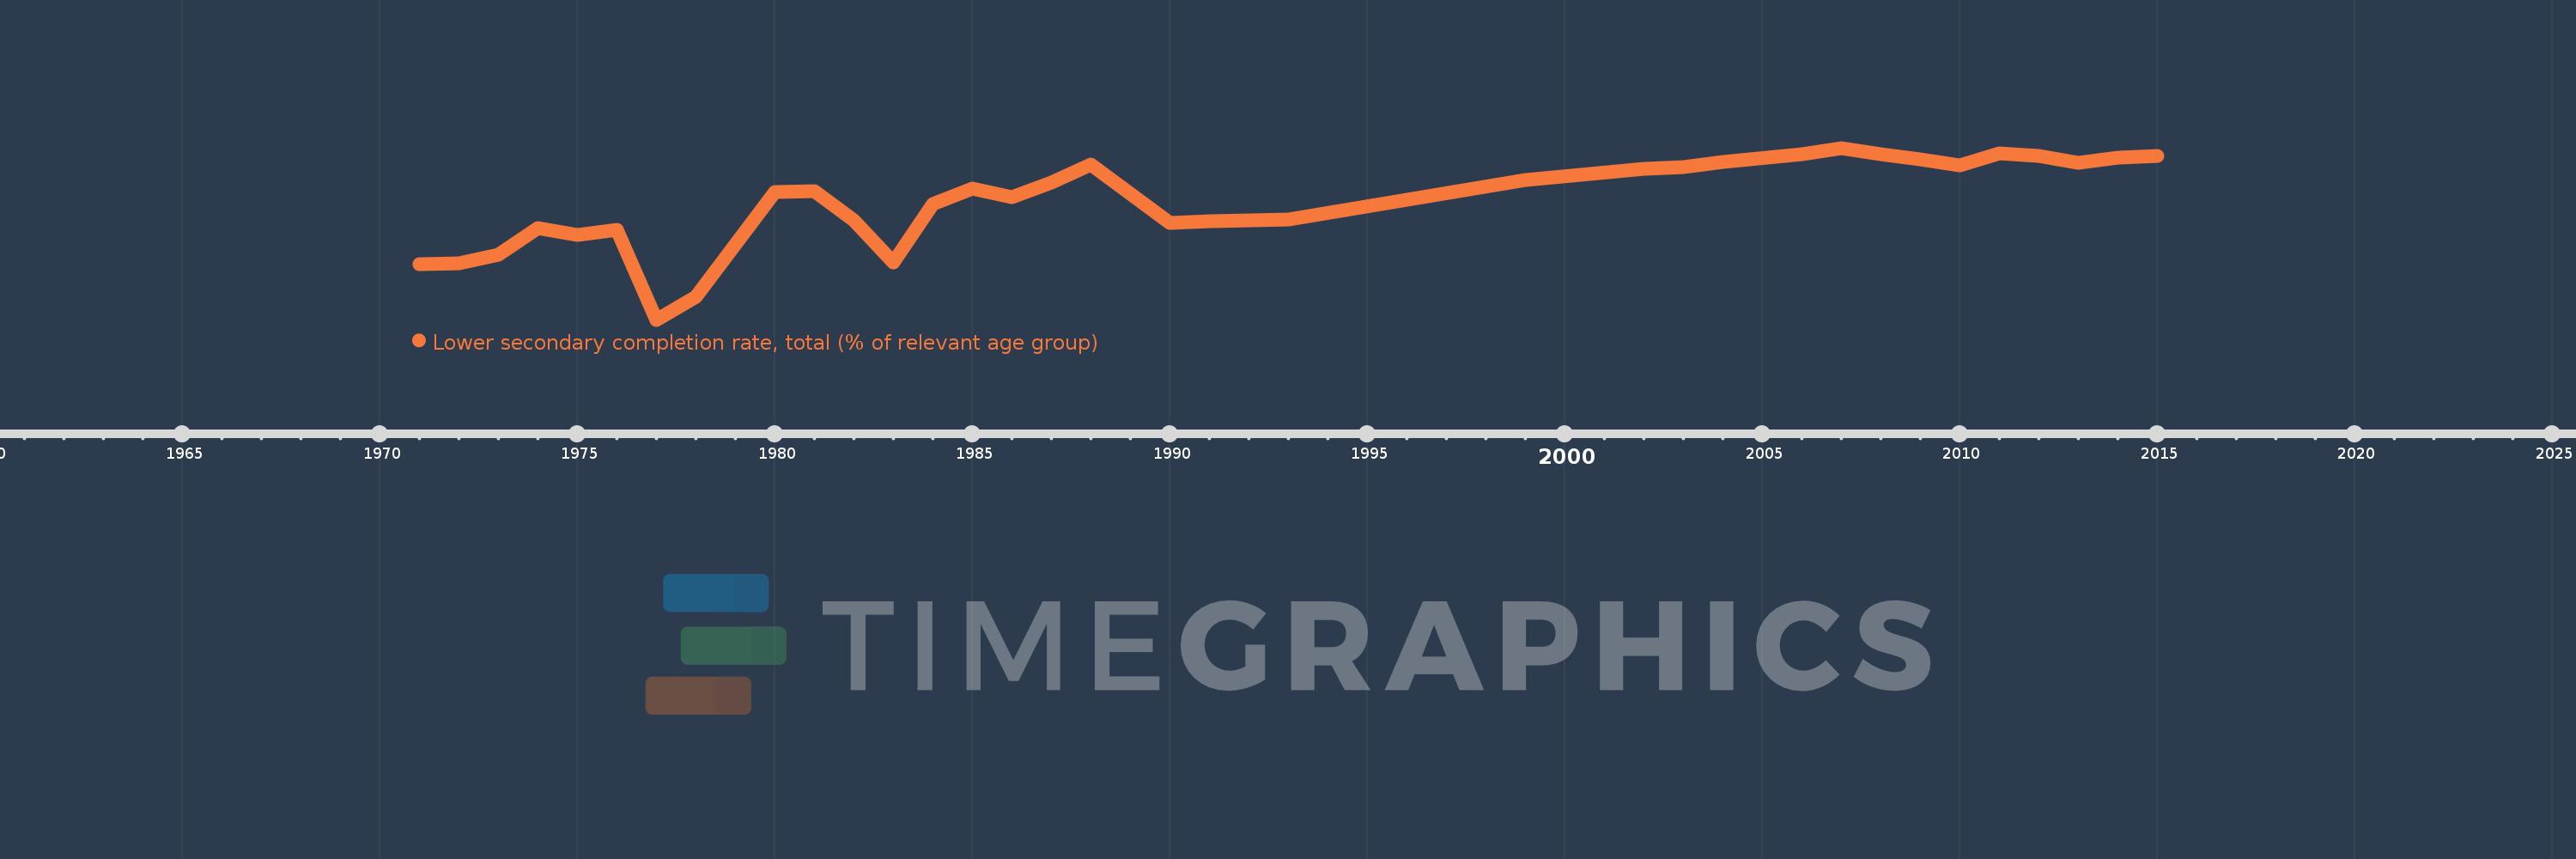
Sri Lanka
LKA
true
2
1
Lower secondary completion rate, total (% of relevant age group)
2015,2014,2013,2012,2011,2010,2009,2008,2007,2006,2004,2003,2002,1999,1993,1992,1991,1990,1988,1987,1986,1985,1984,1983,1982,1981,1980,1978,1977,1976,1975,1974,1973,1972,1971