33
/
AIzaSyB4mHJ5NPEv-XzF7P6NDYXjlkCWaeKw5bc
November 30, 2025
162810
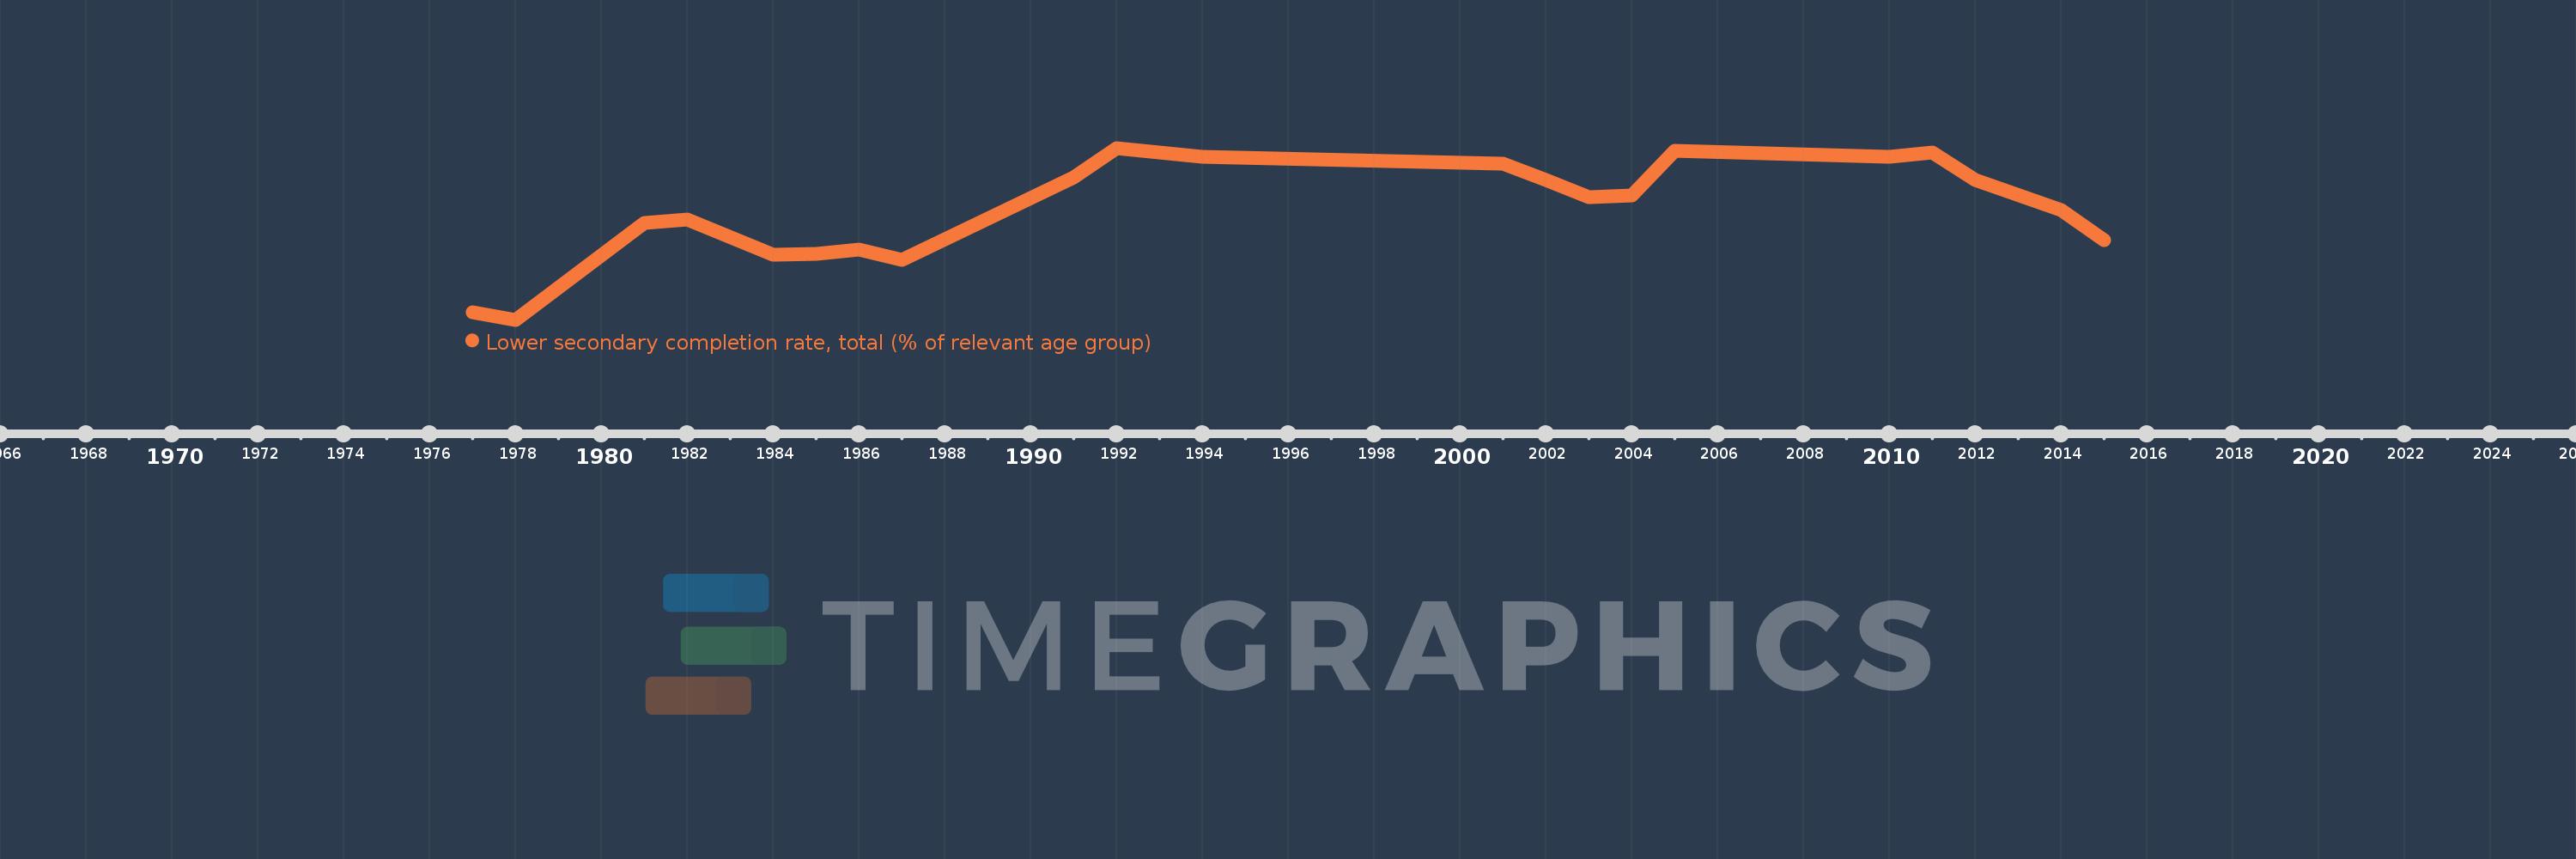
Jamaica
JAM
true
2
1
Lower secondary completion rate, total (% of relevant age group)
2015,2014,2012,2011,2010,2005,2004,2003,2002,2001,1994,1992,1991,1987,1986,1985,1984,1982,1981,1978,1977