33
/
AIzaSyB4mHJ5NPEv-XzF7P6NDYXjlkCWaeKw5bc
November 30, 2025
247969
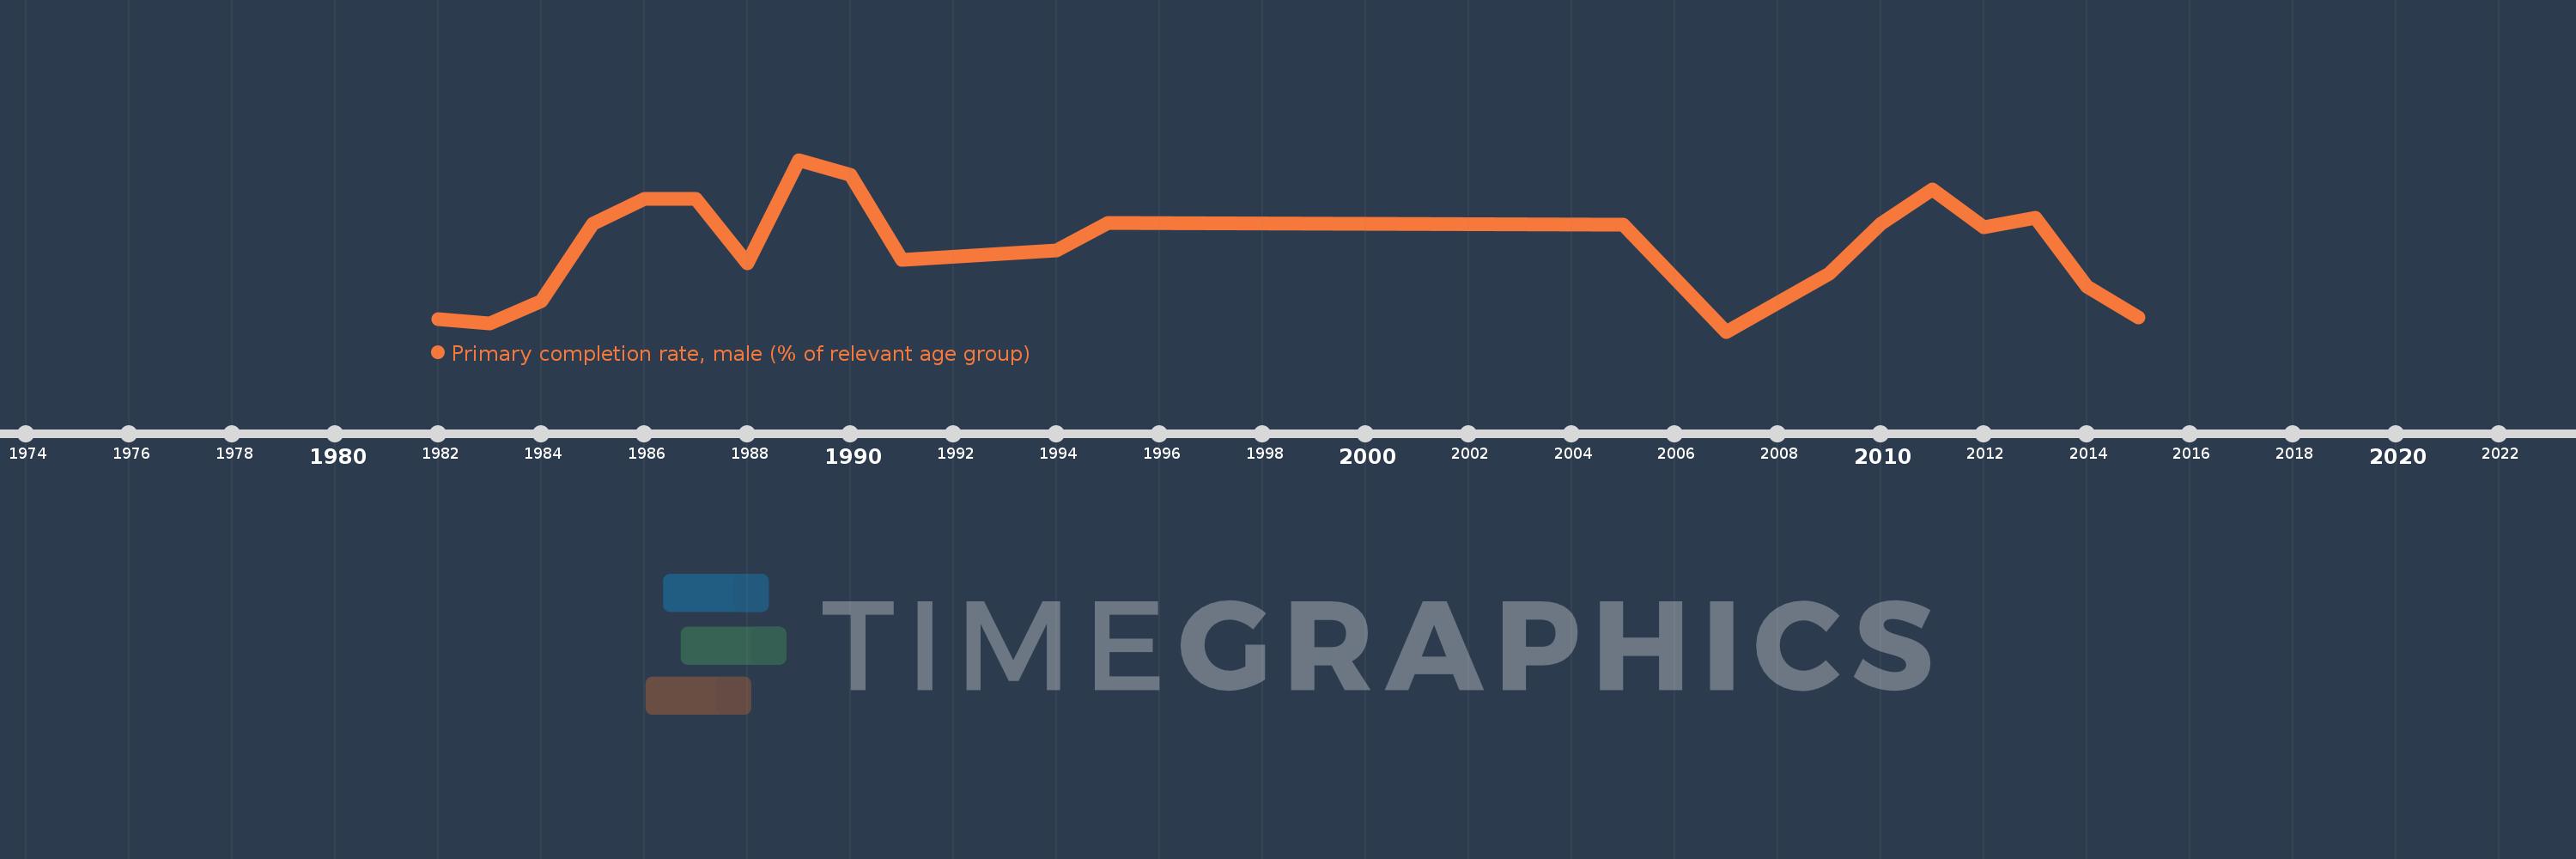
Spain
ESP
true
2
1
Primary completion rate, male (% of relevant age group)
2015,2014,2013,2012,2011,2010,2009,2008,2007,2005,1995,1994,1991,1990,1989,1988,1987,1986,1985,1984,1983,1982