33
/
AIzaSyB4mHJ5NPEv-XzF7P6NDYXjlkCWaeKw5bc
November 30, 2025
125433
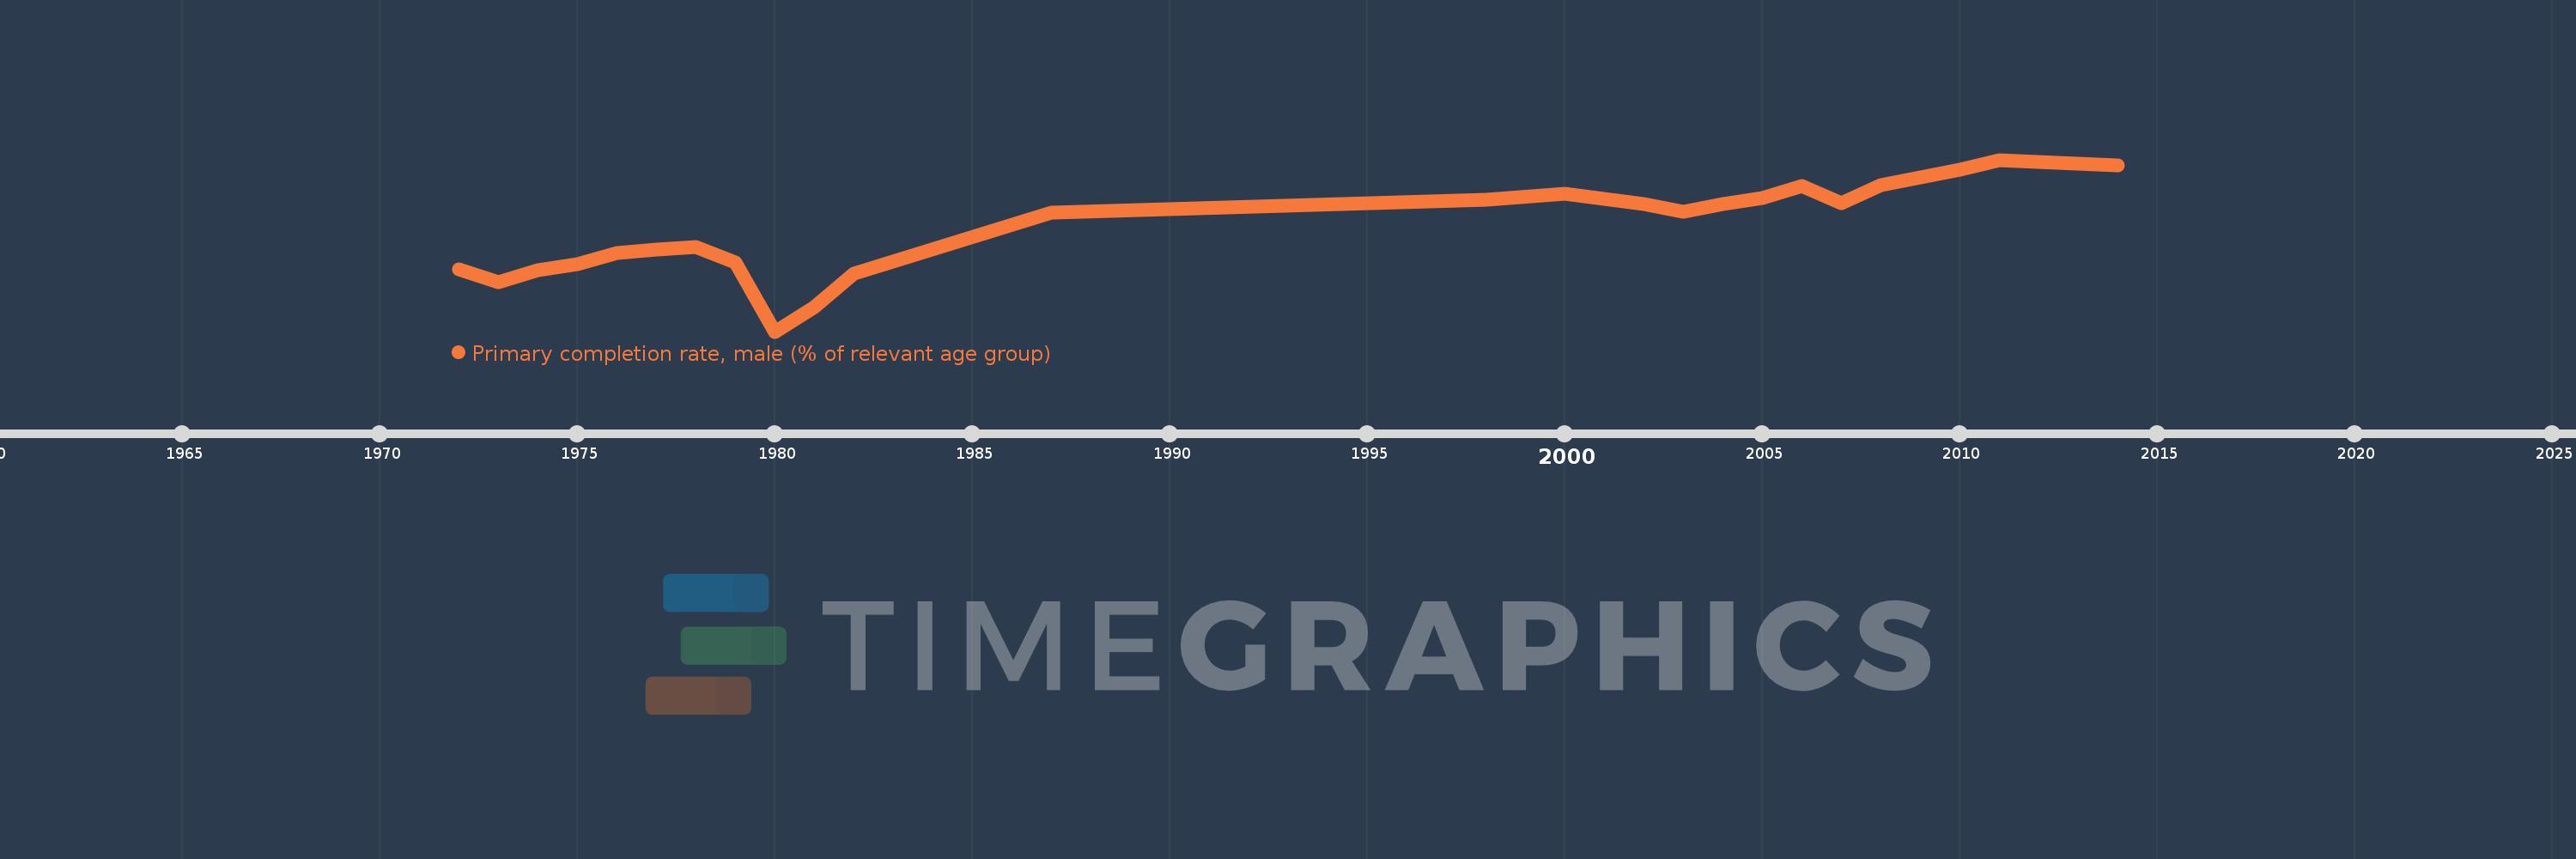
Egypt, Arab Rep.
EGY
true
2
1
Primary completion rate, male (% of relevant age group)
2014,2011,2010,2008,2007,2006,2005,2004,2003,2002,2001,2000,1998,1987,1982,1981,1980,1979,1978,1977,1976,1975,1974,1973,1972