33
/
AIzaSyB4mHJ5NPEv-XzF7P6NDYXjlkCWaeKw5bc
November 30, 2025
245439
South Africa
ZAF
true
2
1
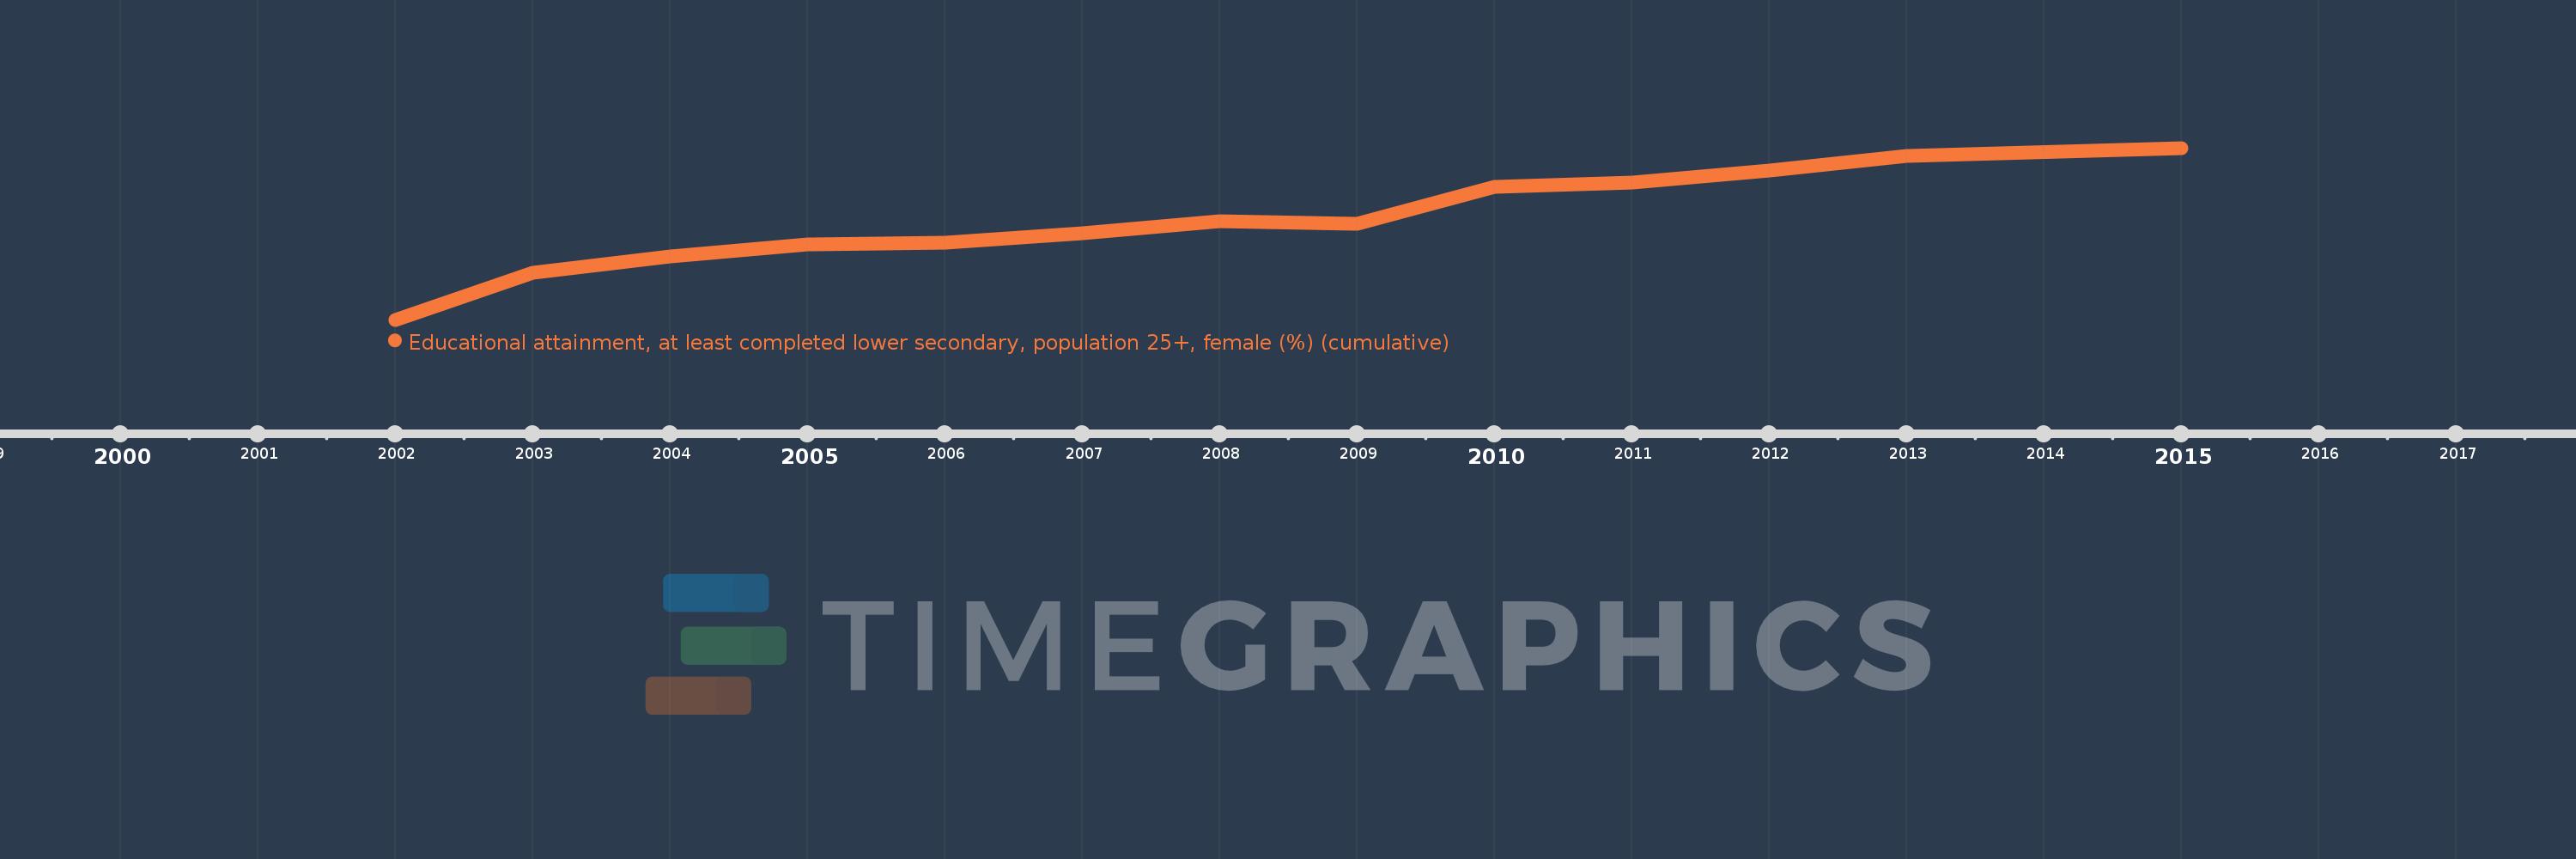
Educational attainment, at least completed lower secondary, population 25+, female (%) (cumulative)
2015,2013,2012,2011,2010,2009,2008,2007,2006,2005,2004,2003,2002