Download This statistics in other country:
Timeline:
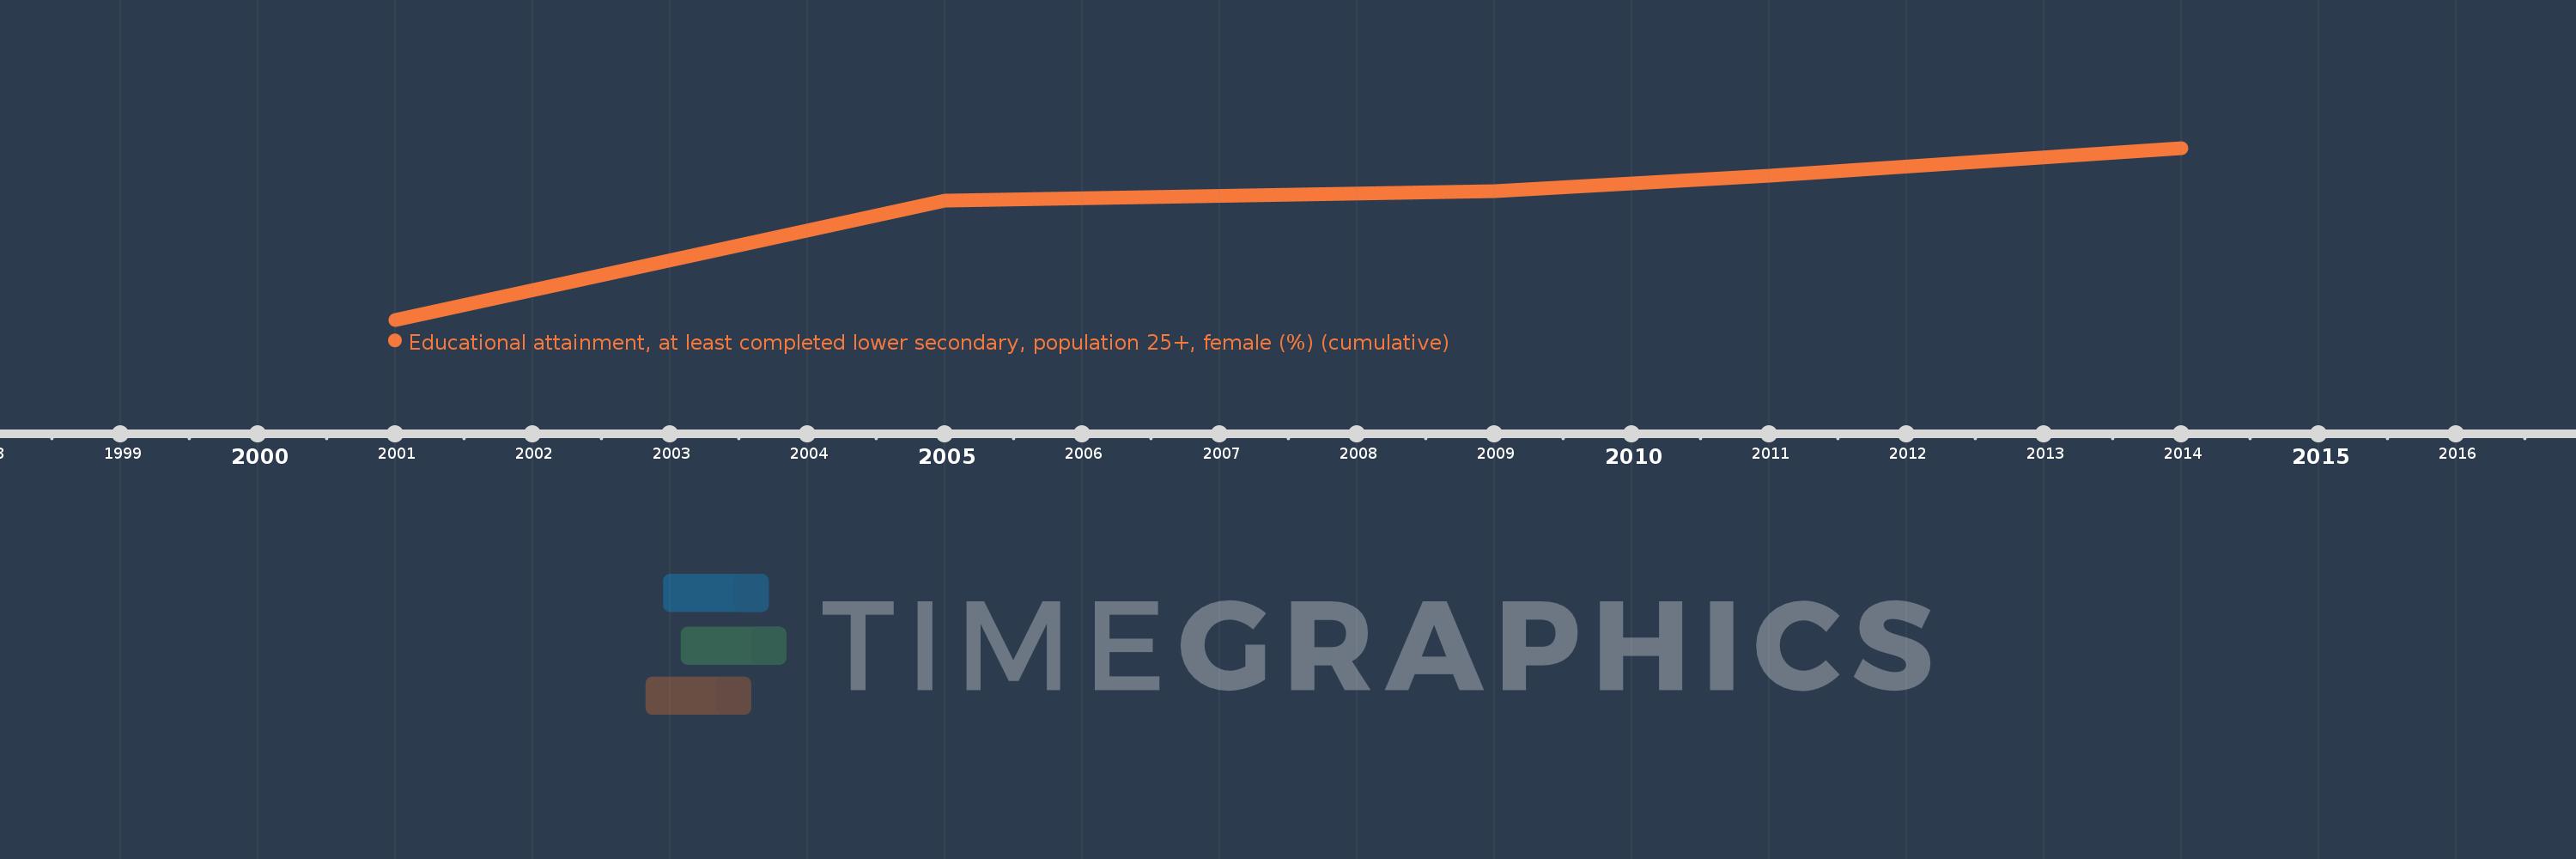
This timeline shows a graph from 2001 to 2014 of Philippines. No data until 2000. Number of actual observations by date: 5.
Source name:
World Development Indicators
Source organization:
United Nations Educational, Scientific, and Cultural Organization (UNESCO) Institute for Statistics.
Categories, topics:
Education, Gender
Last updated:
apr 23, 2017
Indicators value changes by year
Minimum:
50.353
jan 1, 2001
Maximum:
71.107
jan 1, 2014
At the date of observation
Value
Absolute change
Change from the previous value
jan 1, 2001
50.353
+50.353
0.0%
jan 1, 2005
64.779
+14.426
28.65%
jan 1, 2009
65.927
+1.148
1.77%
jan 1, 2011
67.707
+1.78
2.7%
jan 1, 2014
71.107
+3.401
5.02%
Ranking of countries by current statistics by years