33
/
AIzaSyB4mHJ5NPEv-XzF7P6NDYXjlkCWaeKw5bc
November 1, 2025
244962
Somalia
SOM
true
2
1
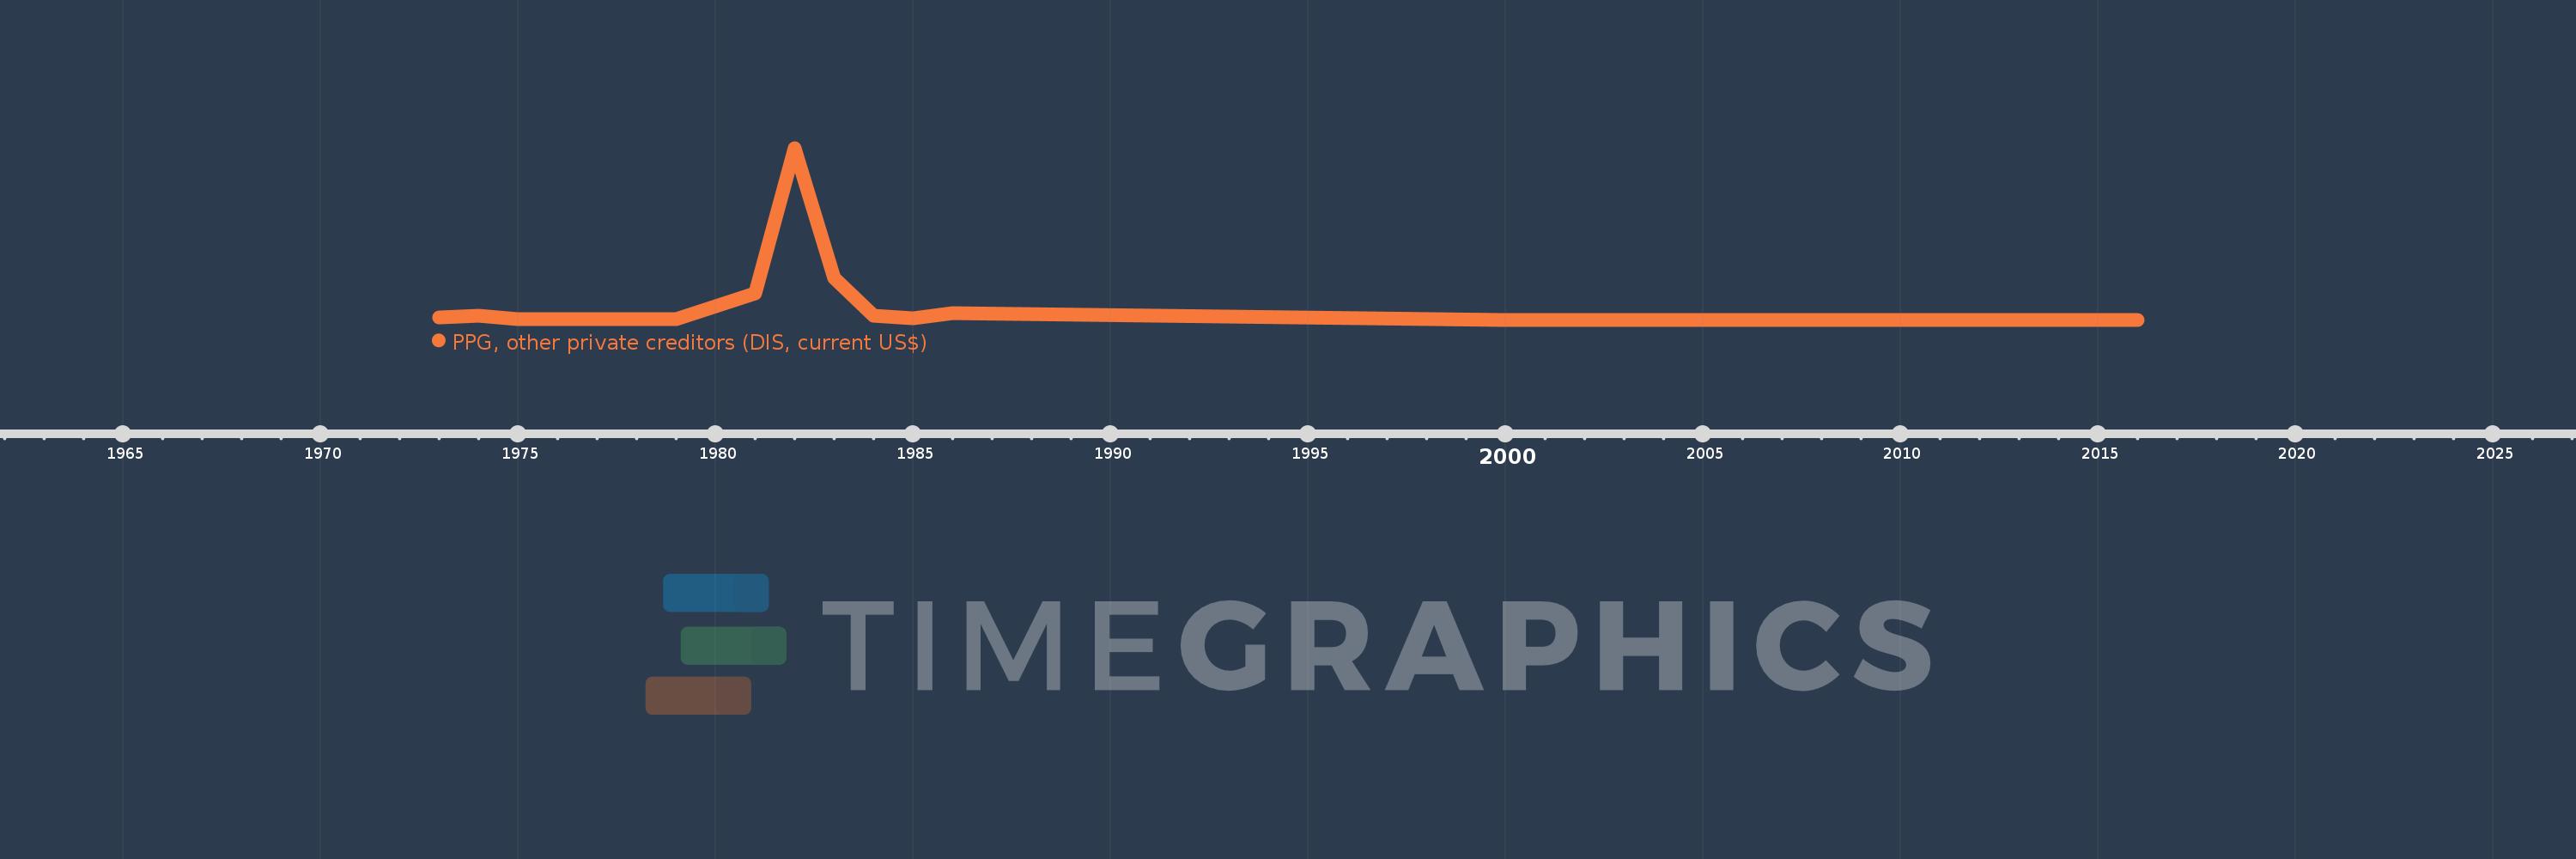
PPG, other private creditors (DIS, current US$)
2016,2014,2012,2011,2010,2009,2008,2007,2006,2005,2004,2003,2002,2001,2000,1986,1985,1984,1983,1982,1981,1979,1975,1974,1973