33
/
AIzaSyB4mHJ5NPEv-XzF7P6NDYXjlkCWaeKw5bc
November 30, 2025
220105
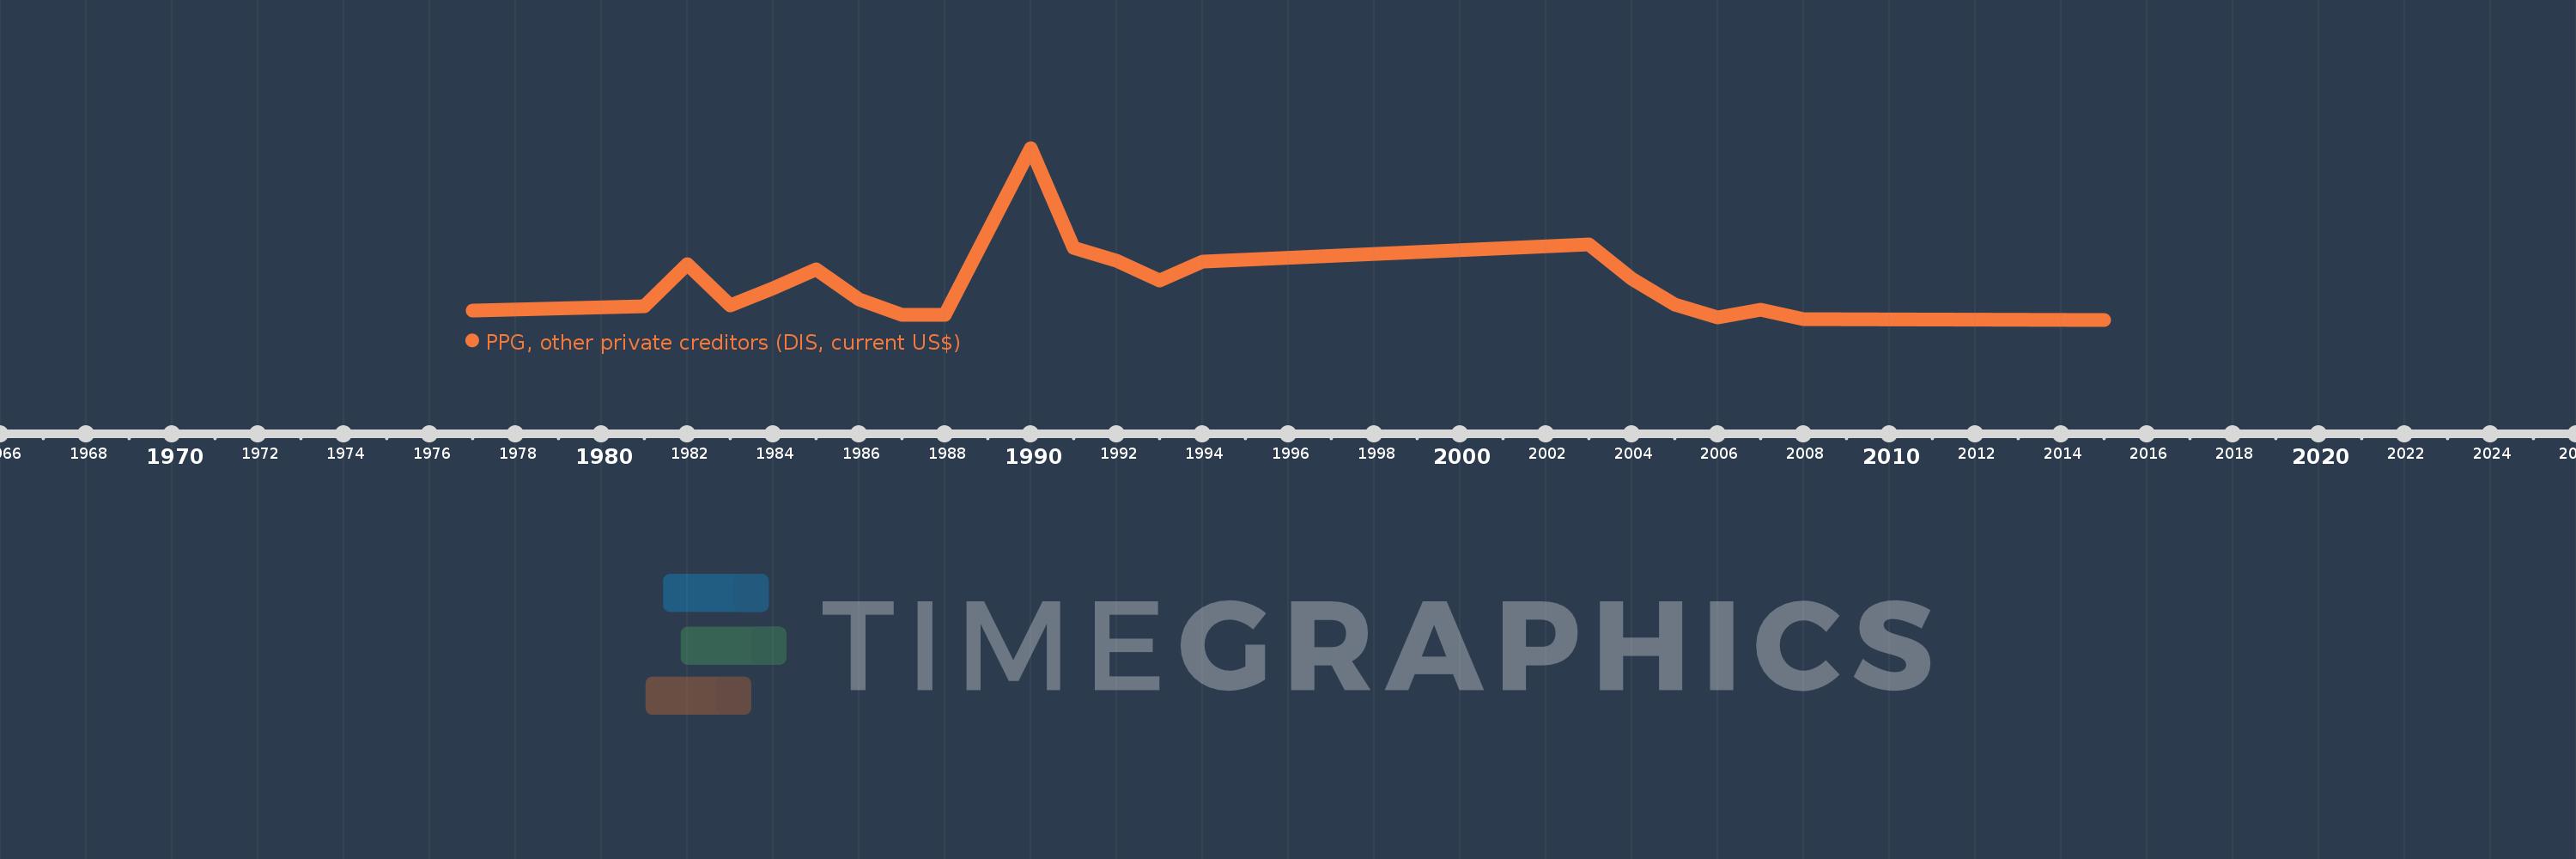
Papua New Guinea
PNG
true
2
1
PPG, other private creditors (DIS, current US$)
2015,2008,2007,2006,2005,2004,2003,1994,1993,1992,1991,1990,1988,1987,1986,1985,1984,1983,1982,1981,1977