Download This statistics in other country:
AfghanistanAlbaniaAlgeriaAngolaArmeniaAustraliaAustriaAzerbaijanBahrainBangladeshBarbadosBelarusBelgiumBelizeBeninBhutanBoliviaBosnia and HerzegovinaBotswanaBrazilBulgariaBurkina FasoBurundiCabo VerdeCambodiaCanadaCentral African RepublicChileColombiaCongo, Dem. Rep.Congo, Rep.Costa RicaCote d'IvoireCroatiaCyprusCzech RepublicDenmarkDominican RepublicEgypt, Arab Rep.El SalvadorEquatorial GuineaEstoniaEthiopiaFijiFinlandFranceGambia, TheGeorgiaGermanyGhanaGreeceGrenadaGuatemalaHondurasHong Kong SAR, ChinaHungaryIcelandIndiaIndonesiaIran, Islamic Rep.IraqIrelandIsraelItalyJamaicaJapanJordanKazakhstanKenyaKiribatiKorea, Rep.KuwaitKyrgyz RepublicLao PDRLatviaLebanonLesothoLithuaniaLuxembourgMacao SAR, ChinaMacedonia, FYRMadagascarMalawiMalaysiaMaldivesMaliMaltaMauritiusMicronesia, Fed. Sts.MoldovaMongoliaMoroccoMozambiqueNamibiaNepalNetherlandsNew ZealandNicaraguaNorwayOmanPakistanPanamaPapua New GuineaParaguayPeruPhilippinesPolandPortugalQatarRomaniaRussian FederationRwandaSamoaSan MarinoSao Tome and PrincipeSerbiaSeychellesSierra LeoneSlovak RepublicSloveniaSolomon IslandsSouth AfricaSpainSri LankaSurinameSwazilandSwedenSwitzerlandTajikistanTanzaniaThailandTimor-LesteTogoTrinidad and TobagoTunisiaTurkeyUgandaUkraineUnited Arab EmiratesUnited KingdomUnited StatesUruguayVanuatuVenezuela, RBWest Bank and GazaYemen, Rep.Zambia Timeline:
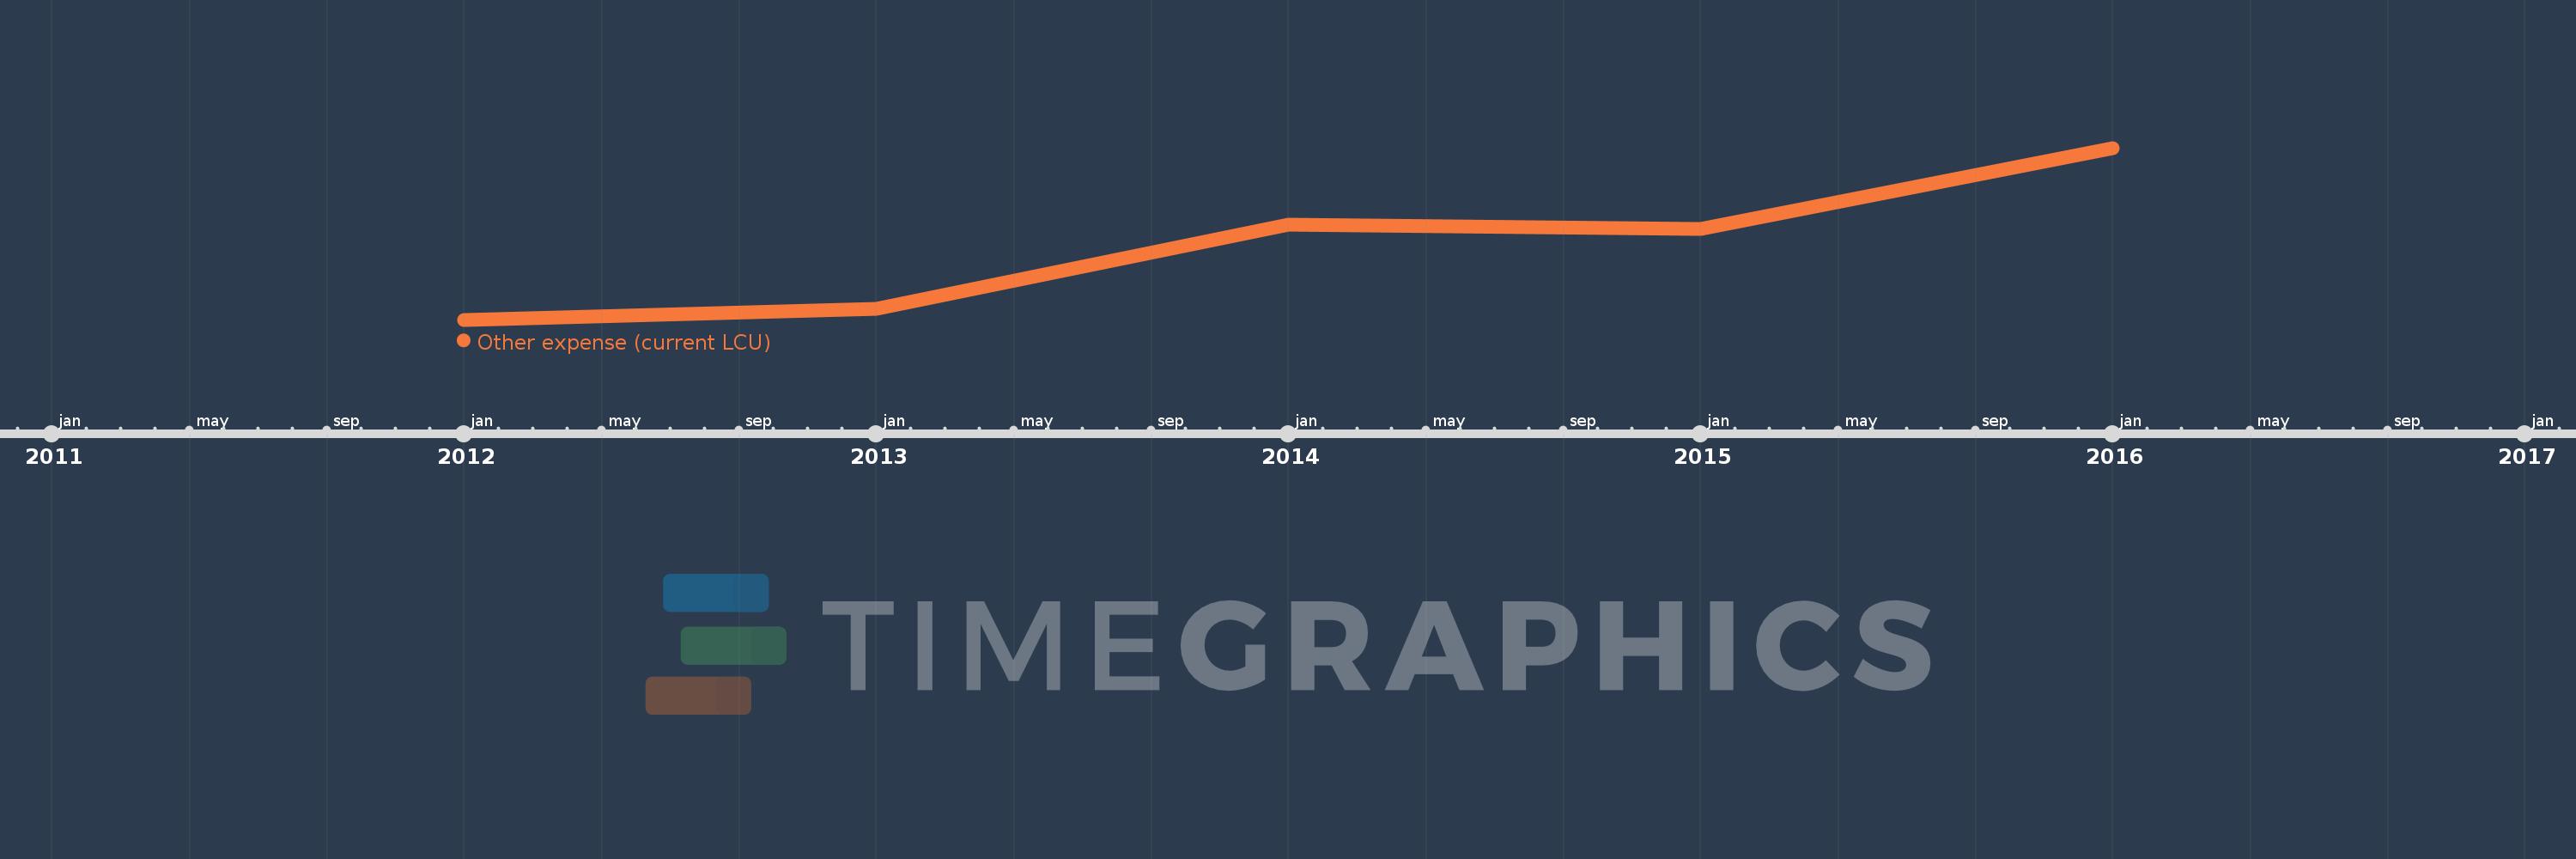
This timeline shows a graph from 2012 to 2016 of Solomon Islands. No data until 2011. Number of actual observations by date: 5.
Source name:
World Development Indicators
Source organization:
International Monetary Fund, Government Finance Statistics Yearbook and data files.
Categories, topics:
Public Sector
Last updated:
apr 23, 2017
Indicators value changes by year
Minimum:
106.938 mln
jan 1, 2012
Maximum:
301.946 mln
jan 1, 2016
At the date of observation
Value
Absolute change
Change from the previous value
jan 1, 2012
106.938 mln
+106.938 mln
0.0%
jan 1, 2013
119.661 mln
+12.723 mln
11.9%
jan 1, 2014
214.964 mln
+95.303 mln
79.64%
jan 1, 2015
210.225 mln
-4.739 mln
-2.2%
jan 1, 2016
301.946 mln
+91.721 mln
43.63%
Ranking of countries by current statistics by years