33
/
AIzaSyB4mHJ5NPEv-XzF7P6NDYXjlkCWaeKw5bc
November 30, 2025
222642
Peru
PER
true
2
1
Other expense (current LCU)
2016,2015,2014,2013,2012,2011,2010,2009,2008,2007,2006,2005,2004,2003,2002,2001,2000,1999,1998,1997,1996,1995,1994,1993,1992,1991
Create a timeline
Public Timelines
For education
For educational institutions
For teachers
For students
Cabinet
For educational institutions
For teachers
For students
Open cabinet
FAQ
Close
Create a timeline
Public timelines
FAQ
About & Feedback
Terms
Privacy
FAQ
Support 24/7
Cabinet
Get premium
Donate
Download
Global statistics library
→
Peru
→
Other expense (current LCU)
This statistics in other country:
Afghanistan
Albania
Algeria
Angola
Armenia
Australia
Austria
Azerbaijan
Bahrain
Bangladesh
Barbados
Belarus
Belgium
Belize
Benin
Bhutan
Bolivia
Bosnia and Herzegovina
Botswana
Brazil
Bulgaria
Burkina Faso
Burundi
Cabo Verde
Cambodia
Canada
Central African Republic
Chile
Colombia
Congo, Dem. Rep.
Congo, Rep.
Costa Rica
Cote d'Ivoire
Croatia
Cyprus
Czech Republic
Denmark
Dominican Republic
Egypt, Arab Rep.
El Salvador
Equatorial Guinea
Estonia
Ethiopia
Fiji
Finland
France
Gambia, The
Georgia
Germany
Ghana
Greece
Grenada
Guatemala
Honduras
Hong Kong SAR, China
Hungary
Iceland
India
Indonesia
Iran, Islamic Rep.
Iraq
Ireland
Israel
Italy
Jamaica
Japan
Jordan
Kazakhstan
Kenya
Kiribati
Korea, Rep.
Kuwait
Kyrgyz Republic
Lao PDR
Latvia
Lebanon
Lesotho
Lithuania
Luxembourg
Macao SAR, China
Macedonia, FYR
Madagascar
Malawi
Malaysia
Maldives
Mali
Malta
Mauritius
Micronesia, Fed. Sts.
Moldova
Mongolia
Morocco
Mozambique
Namibia
Nepal
Netherlands
New Zealand
Nicaragua
Norway
Oman
Pakistan
Panama
Papua New Guinea
Paraguay
Peru
Philippines
Poland
Portugal
Qatar
Romania
Russian Federation
Rwanda
Samoa
San Marino
Sao Tome and Principe
Serbia
Seychelles
Sierra Leone
Slovak Republic
Slovenia
Solomon Islands
South Africa
Spain
Sri Lanka
Suriname
Swaziland
Sweden
Switzerland
Tajikistan
Tanzania
Thailand
Timor-Leste
Togo
Trinidad and Tobago
Tunisia
Turkey
Uganda
Ukraine
United Arab Emirates
United Kingdom
United States
Uruguay
Vanuatu
Venezuela, RB
West Bank and Gaza
Yemen, Rep.
Zambia
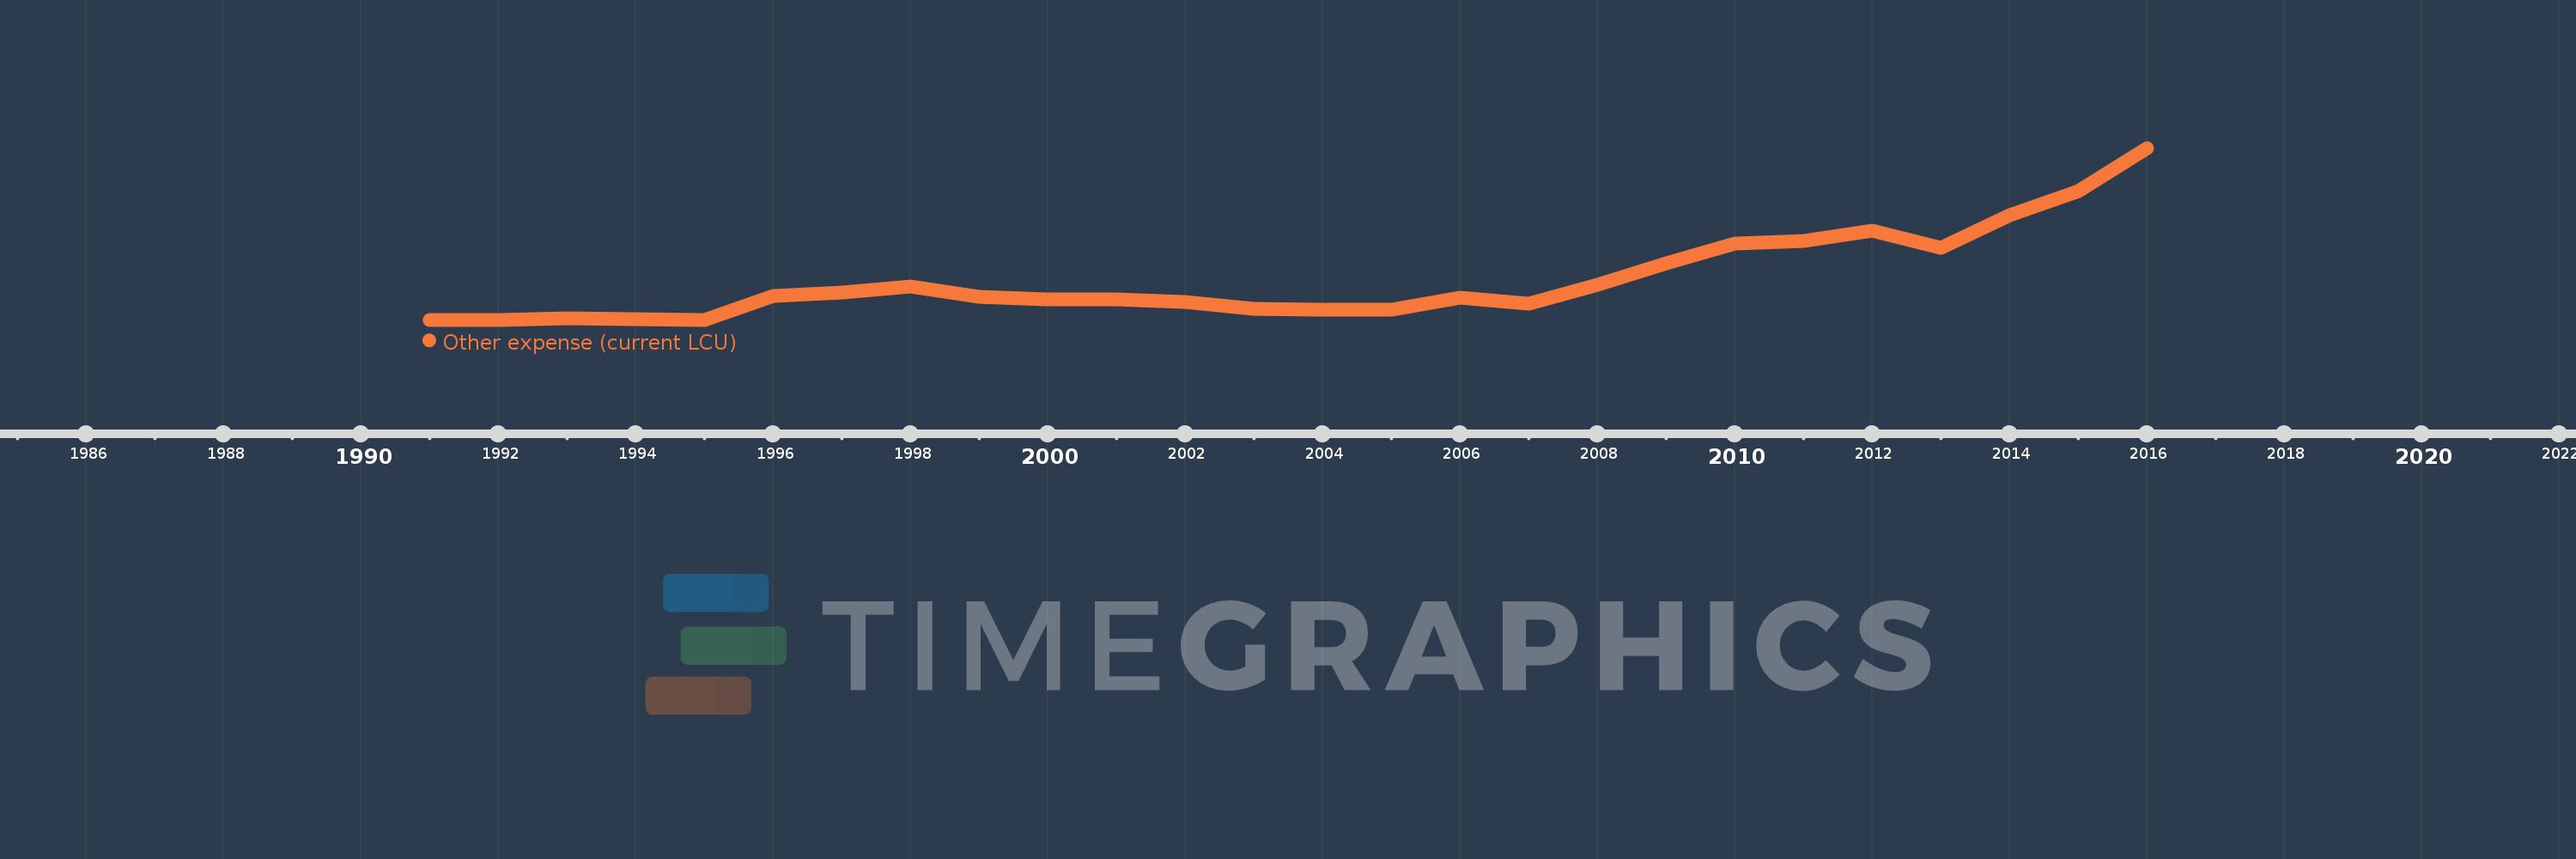
Timeline:
This timeline shows a graph from
1991
to
2016
of Peru. No data until
1990
. Number of actual observations by date:
26
.
Source name:
World Development Indicators
Source organization:
International Monetary Fund, Government Finance Statistics Yearbook and data files.
Categories, topics:
Public Sector
Last updated:
apr 23, 2017
Indicators value changes by year
Meaning:
3.003 bln
Minimum:
3.94 mln
jan 1, 1991
Maximum:
12.755 bln
jan 1, 2016
At the date of observation
Value
Absolute change
Change from the previous value
jan 1, 1991
3.94 mln
+3.94 mln
0.0%
jan 1, 1992
5.0 mln
+1.06 mln
26.9%
jan 1, 1993
122.0 mln
+117.0 mln
2.34K%
jan 1, 1994
57.0 mln
-65.0 mln
-53.28%
jan 1, 1995
4.0 mln
-53.0 mln
-92.98%
jan 1, 1996
1.757 bln
+1.753 bln
43.83K%
jan 1, 1997
2.045 bln
+288.2 mln
16.4%
jan 1, 1998
2.471 bln
+425.3 mln
20.79%
jan 1, 1999
1.72 bln
-750.2 mln
-30.36%
jan 1, 2000
1.495 bln
-225.5 mln
-13.11%
jan 1, 2001
1.511 bln
+16.0 mln
1.07%
jan 1, 2002
1.334 bln
-176.8 mln
-11.7%
jan 1, 2003
791.5 mln
-542.7 mln
-40.68%
jan 1, 2004
747.1 mln
-44.4 mln
-5.61%
jan 1, 2005
780.1 mln
+33.0 mln
4.42%
jan 1, 2006
1.637 bln
+856.9 mln
109.84%
jan 1, 2007
1.192 bln
-445.001 mln
-27.18%
jan 1, 2008
2.623 bln
+1.431 bln
120.01%
jan 1, 2009
4.206 bln
+1.584 bln
60.38%
jan 1, 2010
5.634 bln
+1.428 bln
33.94%
jan 1, 2011
5.875 bln
+241.082 mln
4.28%
jan 1, 2012
6.642 bln
+766.859 mln
13.05%
jan 1, 2013
5.37 bln
-1.272 bln
-19.15%
jan 1, 2014
7.787 bln
+2.417 bln
45.01%
jan 1, 2015
9.518 bln
+1.731 bln
22.23%
jan 1, 2016
12.755 bln
+3.237 bln
34.0%
Ranking of countries by current statistics by years
About & Feedback
Terms
Privacy
FAQ
Support 24/7
Cabinet
Get premium
Donate
The service accepts bank transfer (ACH, Wire) or cards (Visa, MasterCard, etc). Processed by Stripe.
Secured with SSL