Download This statistics in other country:
Timeline:
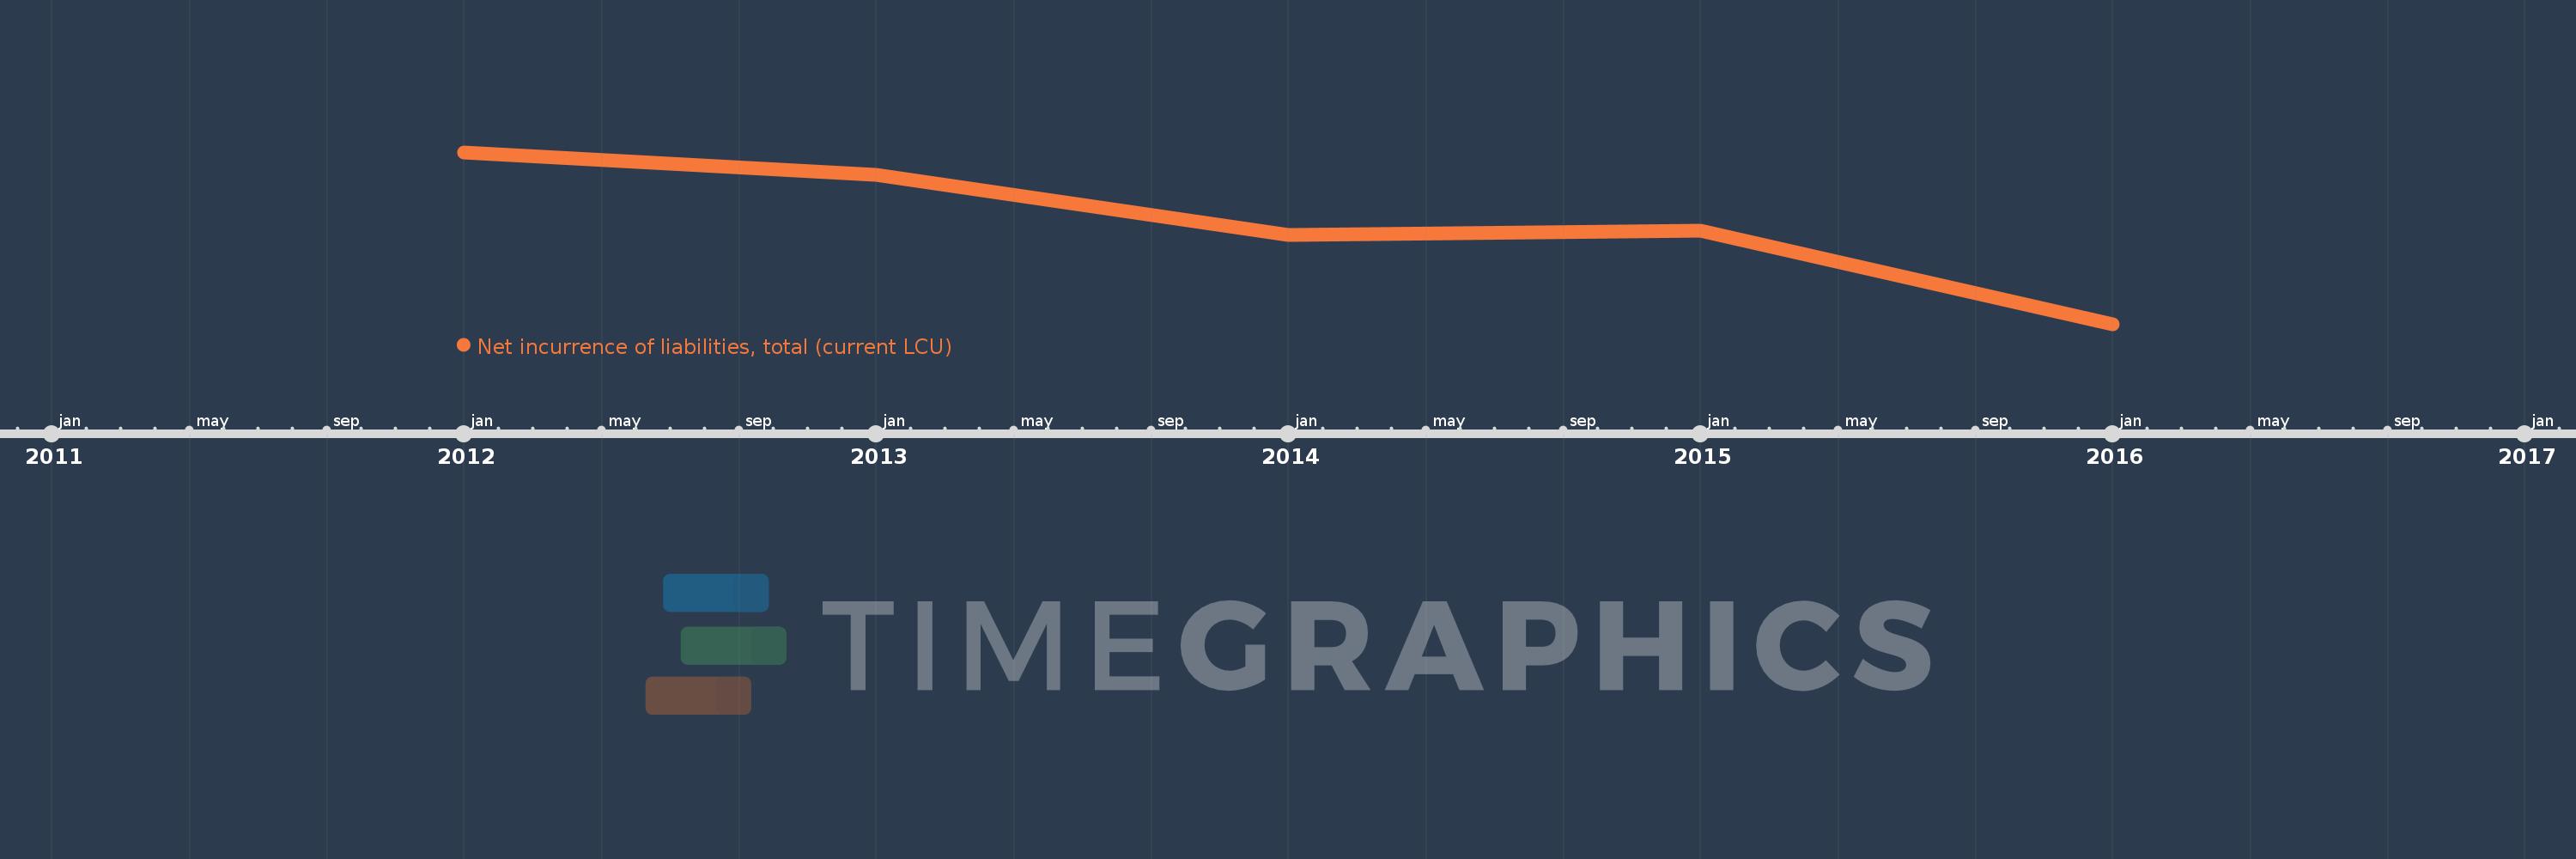
This timeline shows a graph from 2012 to 2016 of Solomon Islands. No data until 2011. Number of actual observations by date: 5.
Source name:
World Development Indicators
Source organization:
International Monetary Fund, Government Finance Statistics Yearbook and data files.
Categories, topics:
Public Sector
Last updated:
apr 23, 2017
Indicators value changes by year
Minimum:
-175.352 mln
jan 1, 2016
Maximum:
2.51 mln
jan 1, 2012
At the date of observation
Value
Absolute change
Change from the previous value
jan 1, 2012
2.51 mln
+2.51 mln
0.0%
jan 1, 2013
-20.817 mln
-23.327 mln
-929.31%
jan 1, 2014
-82.516 mln
-61.699 mln
296.39%
jan 1, 2015
-78.457 mln
+4.06 mln
-4.92%
jan 1, 2016
-175.352 mln
-96.896 mln
123.5%
Ranking of countries by current statistics by years