Download This statistics in other country:
Timeline:
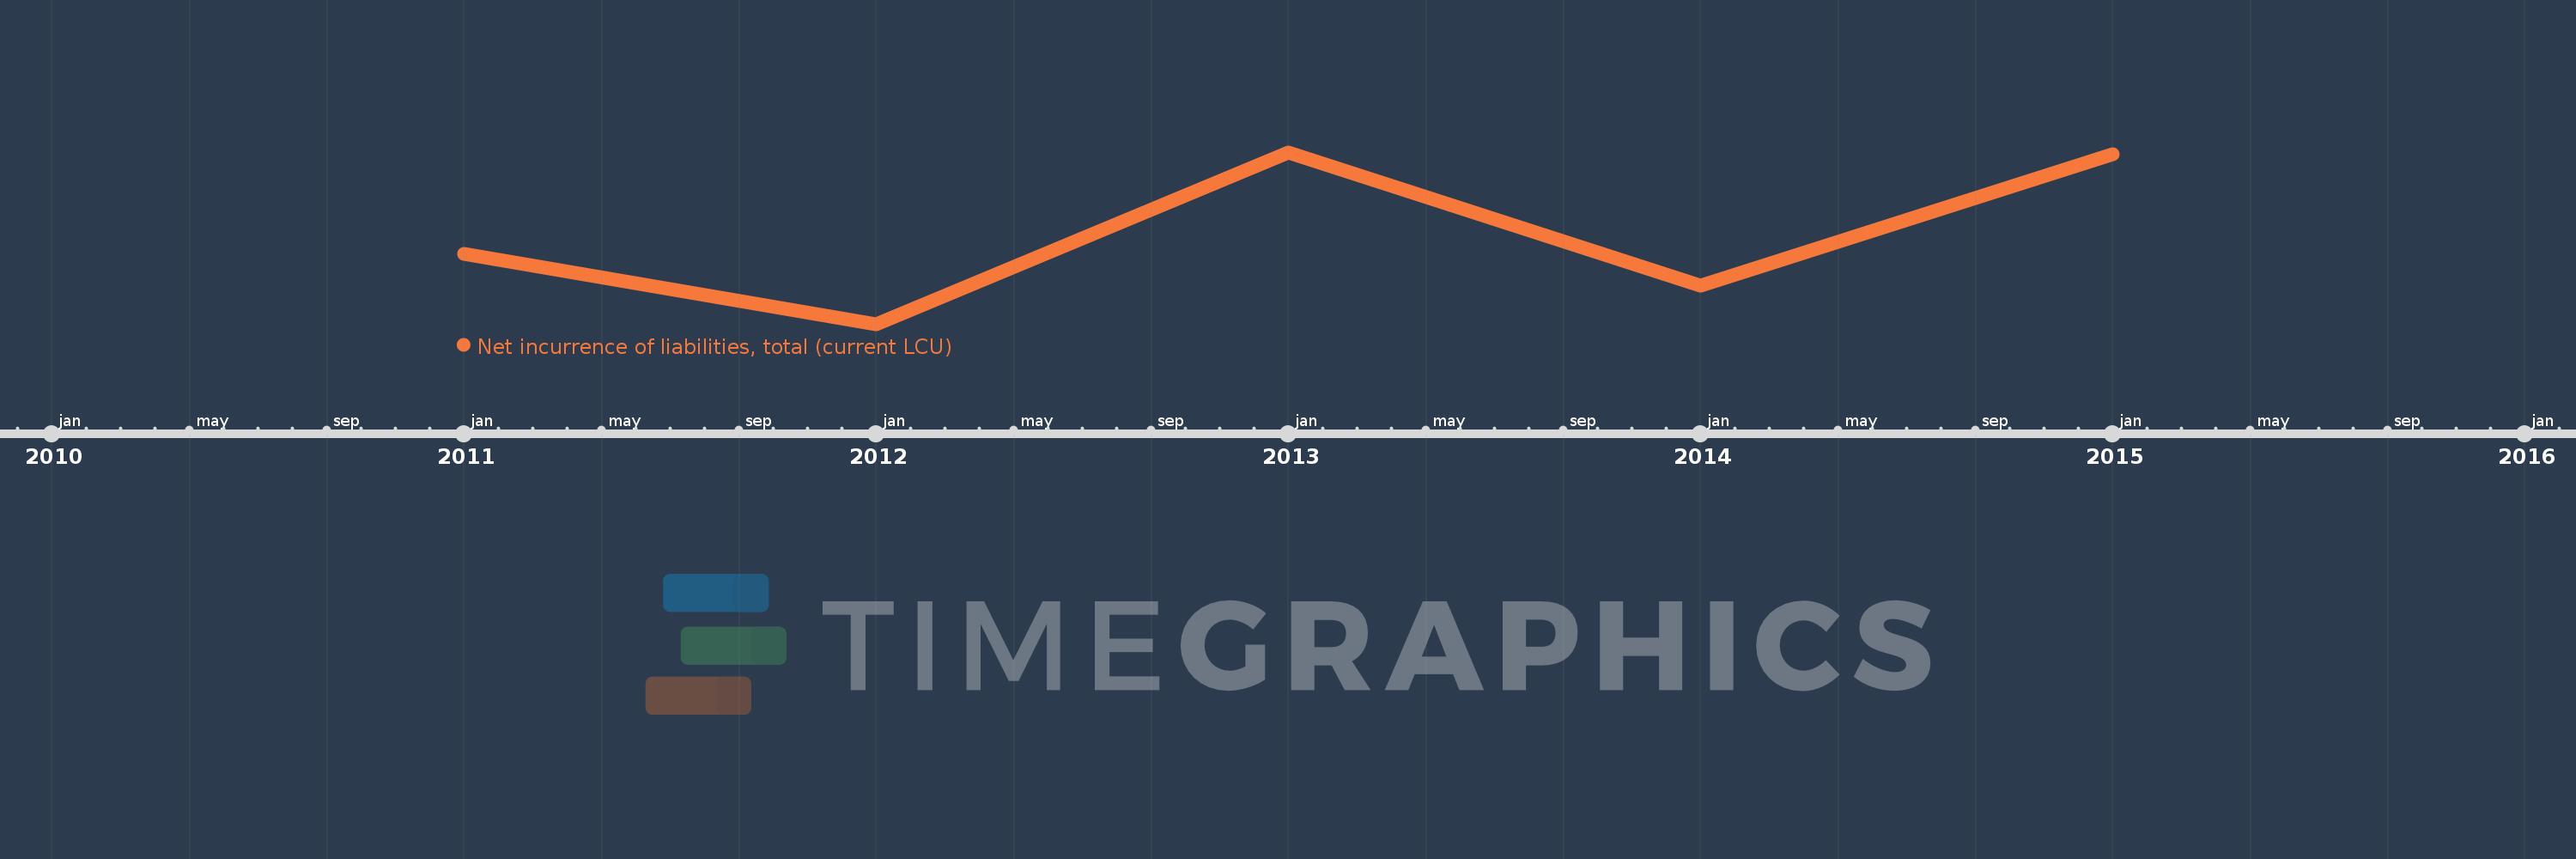
This timeline shows a graph from 2011 to 2015 of Sierra Leone. No data until 2010. Number of actual observations by date: 5.
Source name:
World Development Indicators
Source organization:
International Monetary Fund, Government Finance Statistics Yearbook and data files.
Categories, topics:
Public Sector
Last updated:
apr 23, 2017
Indicators value changes by year
Minimum:
425.346 bln
jan 1, 2012
Maximum:
870.5 bln
jan 1, 2013
At the date of observation
Value
Absolute change
Change from the previous value
jan 1, 2011
607.886 bln
+607.886 bln
0.0%
jan 1, 2012
425.346 bln
-182.54 bln
-30.03%
jan 1, 2013
870.5 bln
+445.154 bln
104.66%
jan 1, 2014
525.358 bln
-345.142 bln
-39.65%
jan 1, 2015
866.625 bln
+341.267 bln
64.96%
Ranking of countries by current statistics by years