33
/
AIzaSyB4mHJ5NPEv-XzF7P6NDYXjlkCWaeKw5bc
November 30, 2025
243651
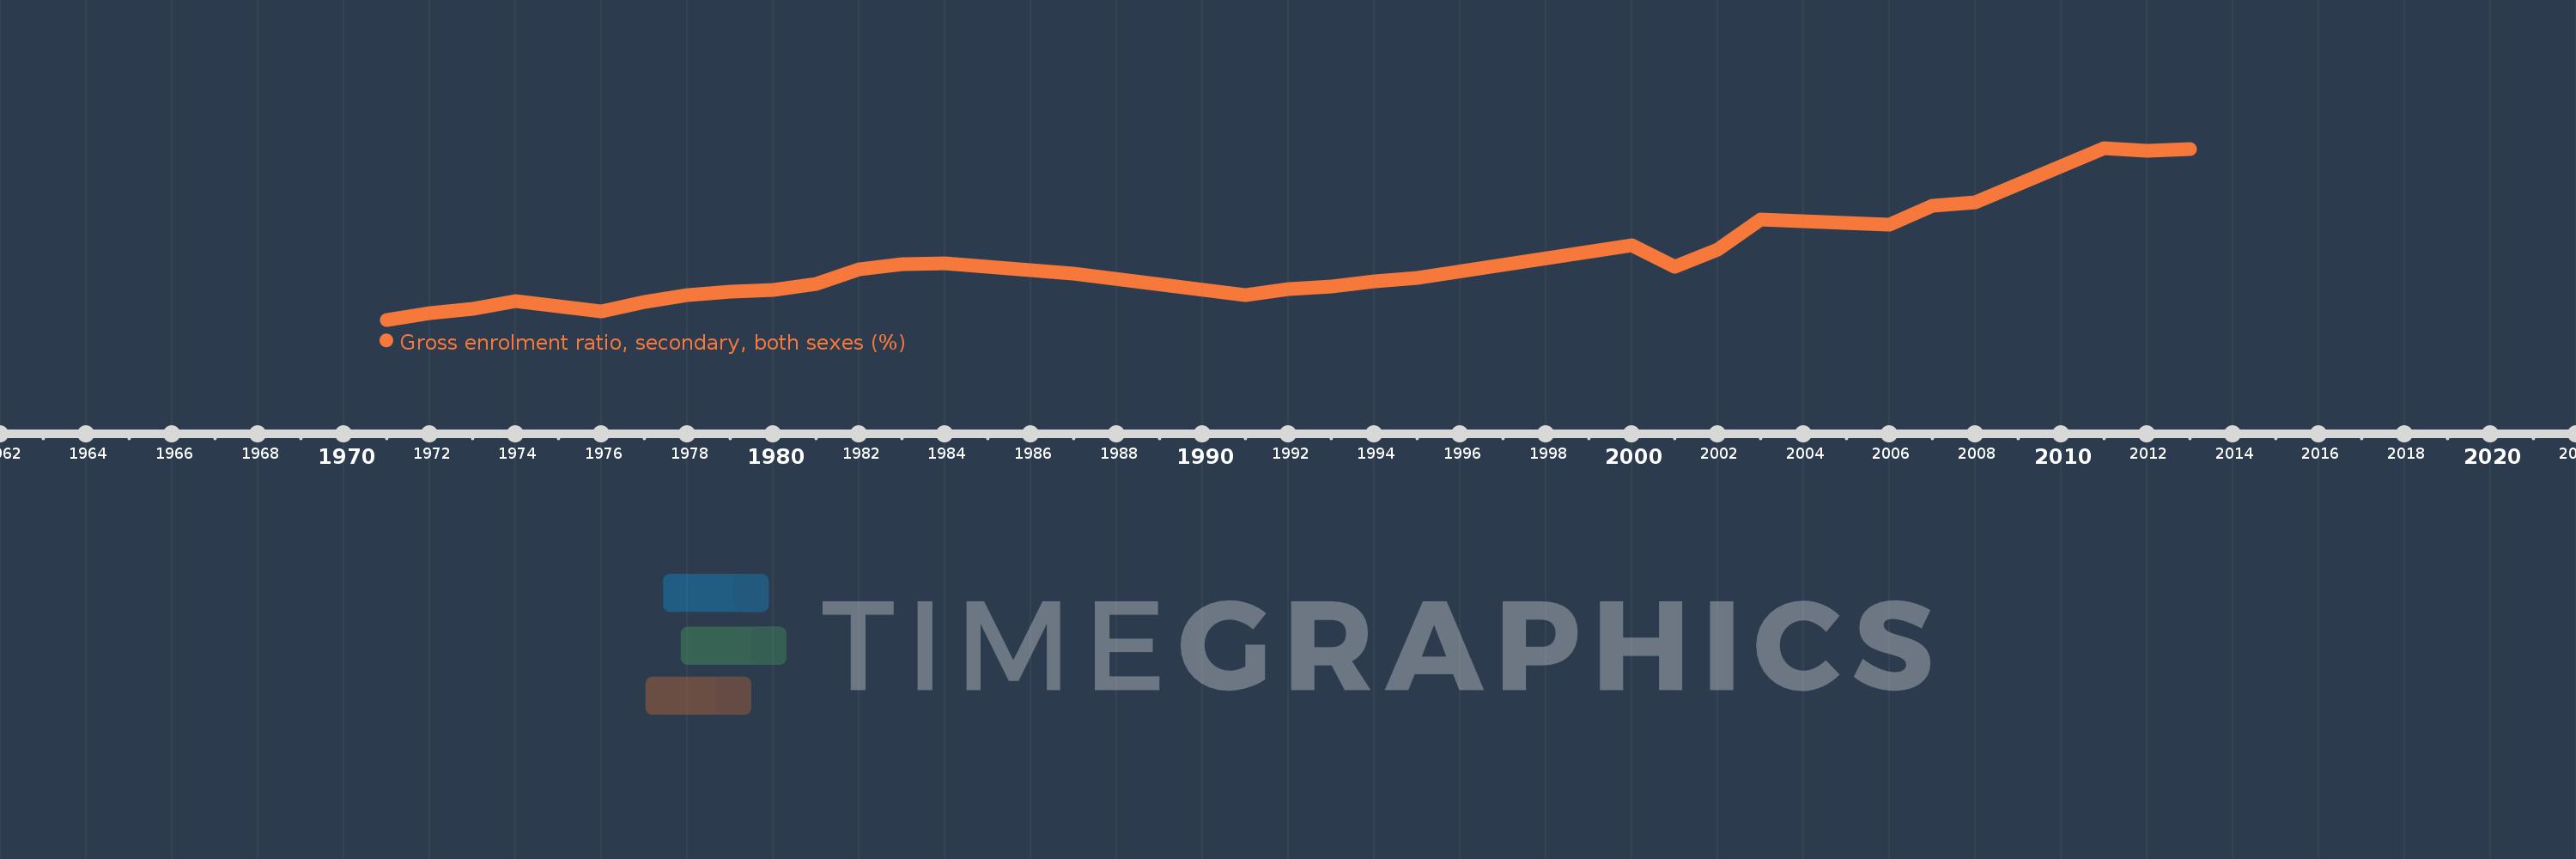
Solomon Islands
SLB
true
2
1
Gross enrolment ratio, secondary, both sexes (%)
2013,2012,2011,2008,2007,2006,2003,2002,2001,2000,1995,1994,1993,1992,1991,1987,1984,1983,1982,1981,1980,1979,1978,1977,1976,1974,1973,1972,1971