33
/
AIzaSyB4mHJ5NPEv-XzF7P6NDYXjlkCWaeKw5bc
November 30, 2025
233666
Sao Tome and Principe
STP
true
2
1
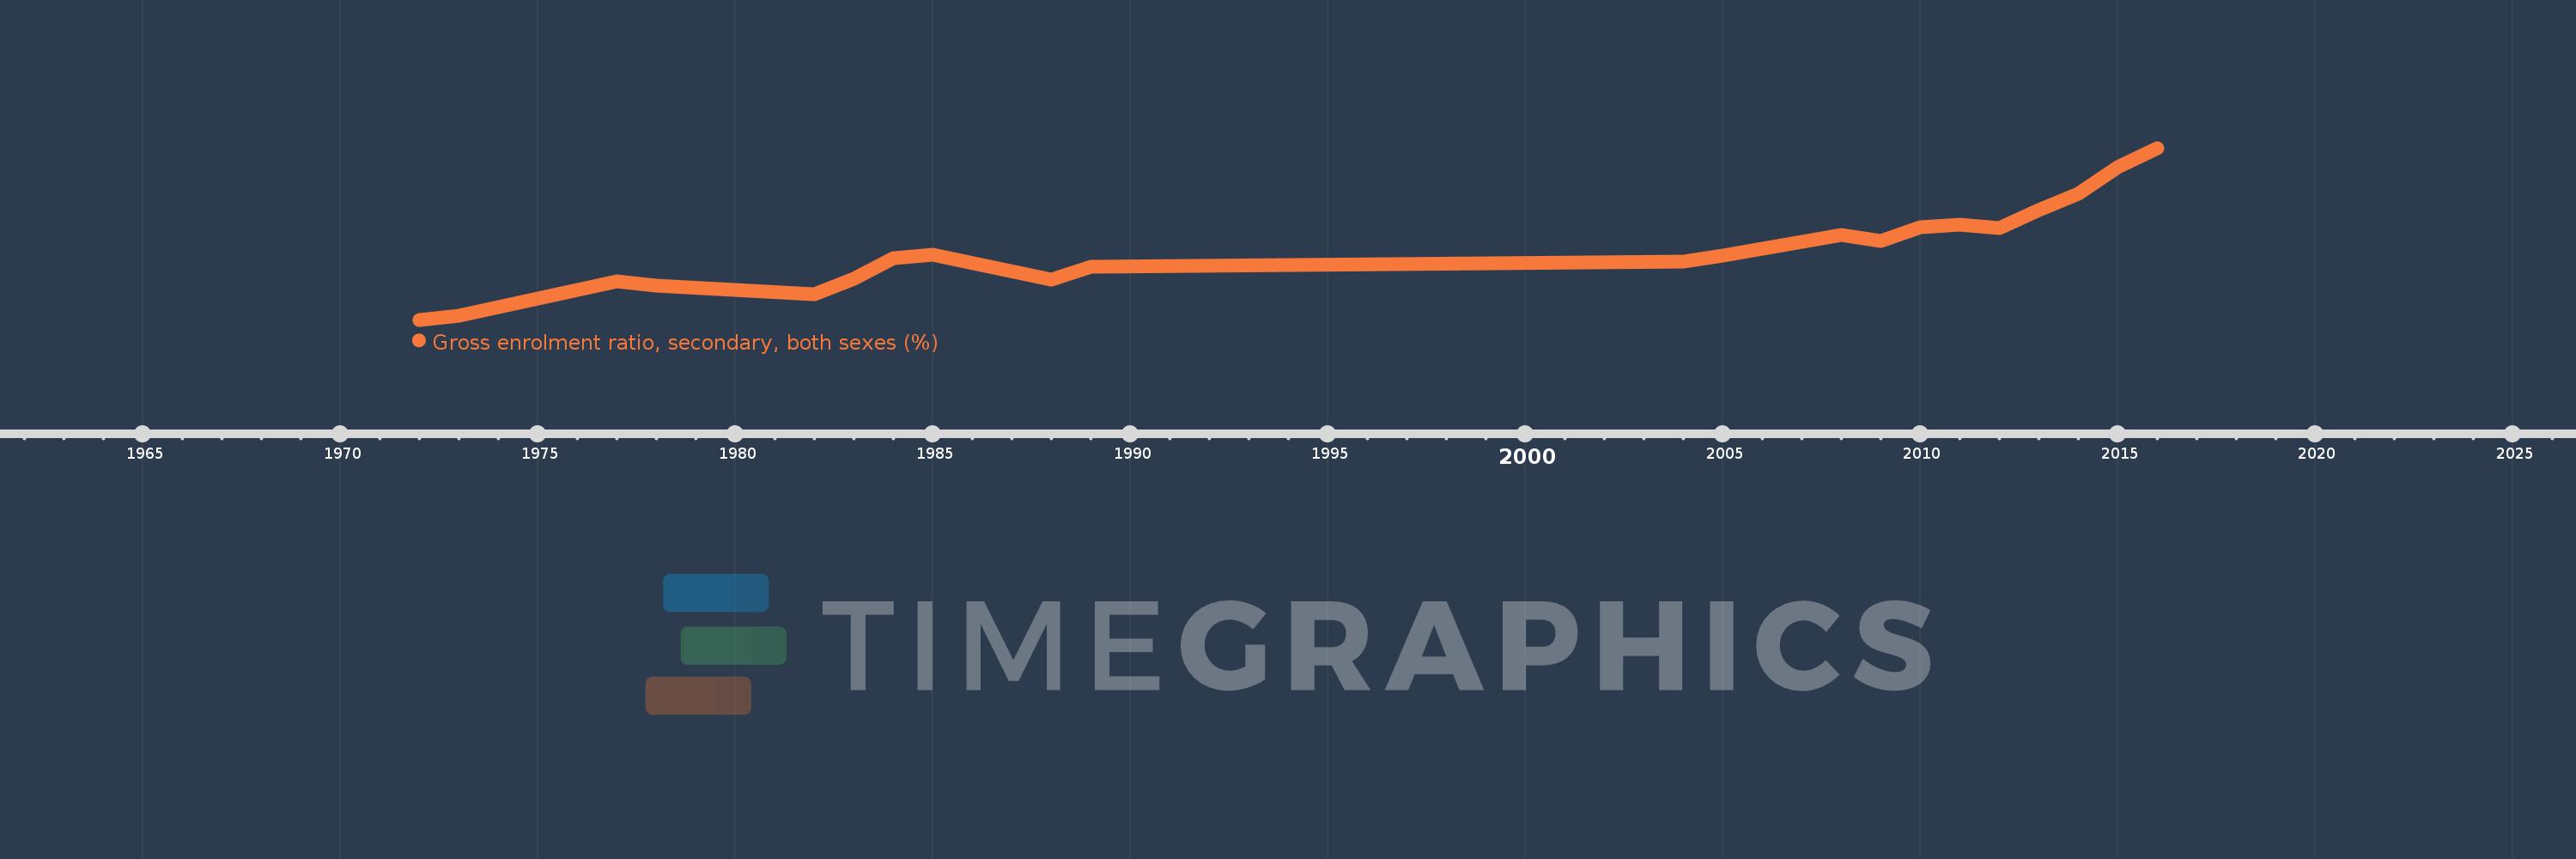
Gross enrolment ratio, secondary, both sexes (%)
2016,2015,2014,2013,2012,2011,2010,2009,2008,2006,2005,2004,1989,1988,1985,1984,1983,1982,1978,1977,1973,1972