Download This statistics in other country:
AlbaniaAlgeriaAmerican SamoaAngolaAntigua and BarbudaArgentinaArubaAustraliaBahamas, TheBahrainBangladeshBarbadosBelgiumBelizeBeninBermudaBrazilBrunei DarussalamBulgariaCabo VerdeCambodiaCameroonCanadaCayman IslandsChileChinaColombiaComorosCongo, Dem. Rep.Congo, Rep.Costa RicaCote d'IvoireCroatiaCubaCuracaoCyprusDenmarkDjiboutiDominicaDominican RepublicEcuadorEgypt, Arab Rep.El SalvadorEquatorial GuineaEritreaEstoniaFaroe IslandsFijiFinlandFranceFrench PolynesiaGabonGambia, TheGeorgiaGermanyGhanaGreeceGreenlandGrenadaGuamGuatemalaGuineaGuinea-BissauGuyanaHaitiHondurasHong Kong SAR, ChinaIcelandIndiaIndonesiaIran, Islamic Rep.IraqIrelandIsraelItalyJamaicaJapanJordanKenyaKiribatiKorea, Rep.KuwaitLatviaLebanonLiberiaLibyaLithuaniaMadagascarMalaysiaMaldivesMaltaMarshall IslandsMauritaniaMauritiusMexicoMicronesia, Fed. Sts.MontenegroMoroccoMozambiqueMyanmarNamibiaNetherlandsNew CaledoniaNew ZealandNicaraguaNigeriaNorthern Mariana IslandsNorwayOmanPakistanPalauPanamaPapua New GuineaPeruPhilippinesPolandPortugalQatarRomaniaRussian FederationSamoaSao Tome and PrincipeSaudi ArabiaSenegalSerbiaSeychellesSierra LeoneSingaporeSloveniaSolomon IslandsSomaliaSouth AfricaSpainSri LankaSt. Kitts and NevisSt. LuciaSt. Vincent and the GrenadinesSudanSurinameSwedenSyrian Arab RepublicTanzaniaThailandTogoTongaTrinidad and TobagoTunisiaTurkeyUkraineUnited Arab EmiratesUnited KingdomUnited StatesUruguayVanuatuVenezuela, RBVietnamYemen, Rep. Timeline:
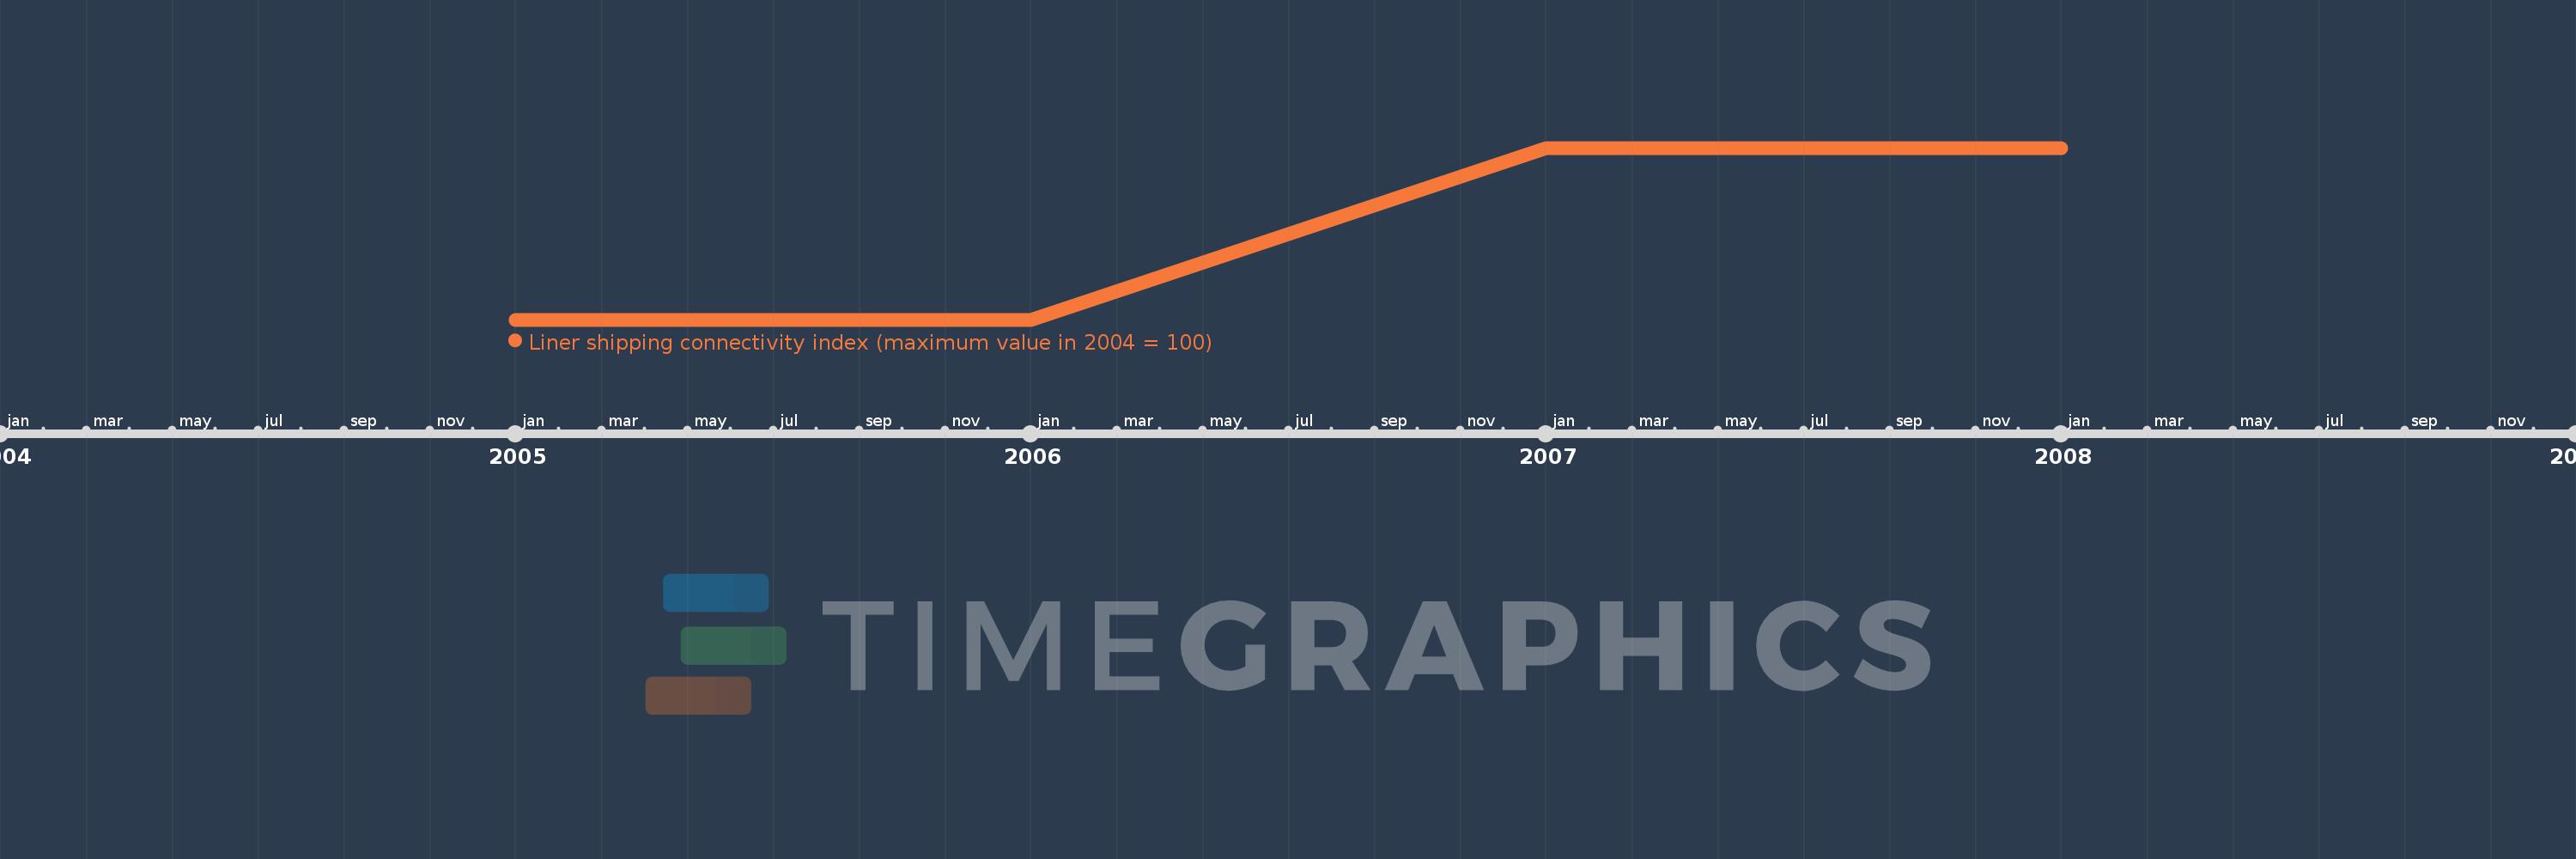
This timeline shows a graph from 2005 to 2008 of Serbia. No data until 2004. Number of actual observations by date: 4.
Source name:
World Development Indicators
Source organization:
United Nations Conference on Trade and Development, Review of Maritime Transport 2010.
Categories, topics:
Infrastructure
Last updated:
apr 23, 2017
Indicators value changes by year
At the date of observation
Value
Absolute change
Change from the previous value
jan 1, 2005
2.92
+2.92
0.0%
jan 1, 2007
2.96
+0.04
1.37%
Ranking of countries by current statistics by years