33
/
AIzaSyB4mHJ5NPEv-XzF7P6NDYXjlkCWaeKw5bc
November 30, 2025
129560
Estonia
EST
true
2
1
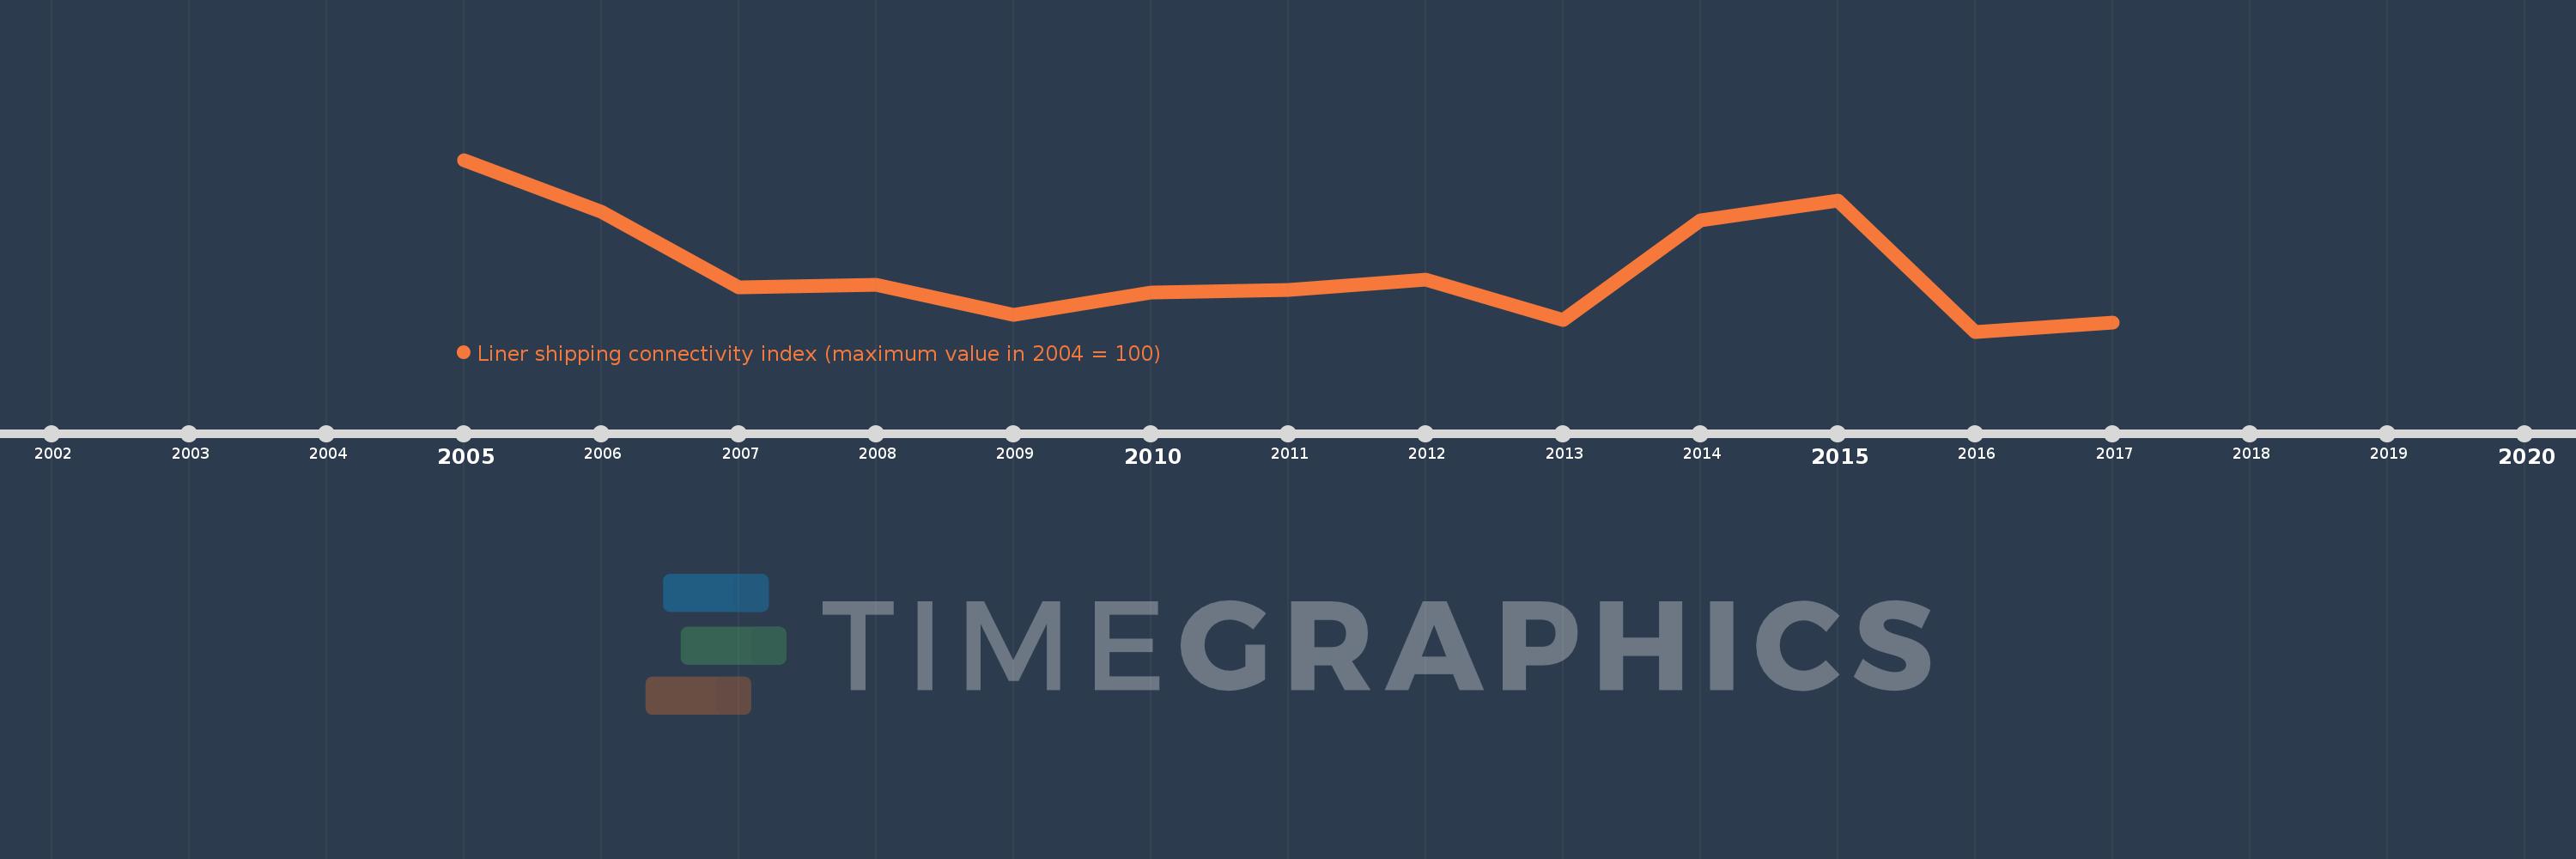
Liner shipping connectivity index (maximum value in 2004 = 100)
2017,2016,2015,2014,2013,2012,2011,2010,2009,2008,2007,2006,2005
Create a timeline
Public Timelines
For education
For educational institutions
For teachers
For students
Cabinet
For educational institutions
For teachers
For students
Open cabinet
FAQ
Close
Create a timeline
Public timelines
FAQ
About & Feedback
Terms
Privacy
FAQ
Support 24/7
Cabinet
Get premium
Donate
Download
Global statistics library
→
Estonia
→
Liner shipping connectivity index (maximum value in 2004 = 100)
This statistics in other country:
Albania
Algeria
American Samoa
Angola
Antigua and Barbuda
Argentina
Aruba
Australia
Bahamas, The
Bahrain
Bangladesh
Barbados
Belgium
Belize
Benin
Bermuda
Brazil
Brunei Darussalam
Bulgaria
Cabo Verde
Cambodia
Cameroon
Canada
Cayman Islands
Chile
China
Colombia
Comoros
Congo, Dem. Rep.
Congo, Rep.
Costa Rica
Cote d'Ivoire
Croatia
Cuba
Curacao
Cyprus
Denmark
Djibouti
Dominica
Dominican Republic
Ecuador
Egypt, Arab Rep.
El Salvador
Equatorial Guinea
Eritrea
Estonia
Faroe Islands
Fiji
Finland
France
French Polynesia
Gabon
Gambia, The
Georgia
Germany
Ghana
Greece
Greenland
Grenada
Guam
Guatemala
Guinea
Guinea-Bissau
Guyana
Haiti
Honduras
Hong Kong SAR, China
Iceland
India
Indonesia
Iran, Islamic Rep.
Iraq
Ireland
Israel
Italy
Jamaica
Japan
Jordan
Kenya
Kiribati
Korea, Rep.
Kuwait
Latvia
Lebanon
Liberia
Libya
Lithuania
Madagascar
Malaysia
Maldives
Malta
Marshall Islands
Mauritania
Mauritius
Mexico
Micronesia, Fed. Sts.
Montenegro
Morocco
Mozambique
Myanmar
Namibia
Netherlands
New Caledonia
New Zealand
Nicaragua
Nigeria
Northern Mariana Islands
Norway
Oman
Pakistan
Palau
Panama
Papua New Guinea
Peru
Philippines
Poland
Portugal
Qatar
Romania
Russian Federation
Samoa
Sao Tome and Principe
Saudi Arabia
Senegal
Serbia
Seychelles
Sierra Leone
Singapore
Slovenia
Solomon Islands
Somalia
South Africa
Spain
Sri Lanka
St. Kitts and Nevis
St. Lucia
St. Vincent and the Grenadines
Sudan
Suriname
Sweden
Syrian Arab Republic
Tanzania
Thailand
Togo
Tonga
Trinidad and Tobago
Tunisia
Turkey
Ukraine
United Arab Emirates
United Kingdom
United States
Uruguay
Vanuatu
Venezuela, RB
Vietnam
Yemen, Rep.
Timeline:
This timeline shows a graph from
2005
to
2017
of Estonia. No data until
2004
. Number of actual observations by date:
13
.
Source name:
World Development Indicators
Source organization:
United Nations Conference on Trade and Development, Review of Maritime Transport 2010.
Categories, topics:
Infrastructure
Last updated:
apr 23, 2017
Indicators value changes by year
Meaning:
5.93
Minimum:
5.31
jan 1, 2016
Maximum:
7.05
jan 1, 2005
At the date of observation
Value
Absolute change
Change from the previous value
jan 1, 2005
7.05
+7.05
0.0%
jan 1, 2006
6.52
-0.53
-7.52%
jan 1, 2007
5.76
-0.76
-11.66%
jan 1, 2008
5.78
+0.02
0.35%
jan 1, 2009
5.48
-0.3
-5.19%
jan 1, 2010
5.71
+0.23
4.2%
jan 1, 2011
5.73
+0.02
0.35%
jan 1, 2012
5.84
+0.11
1.92%
jan 1, 2013
5.43
-0.41
-7.02%
jan 1, 2014
6.44
+1.01
18.6%
jan 1, 2015
6.64
+0.2
3.11%
jan 1, 2016
5.31
-1.33
-20.03%
jan 1, 2017
5.4
+0.09
1.69%
Ranking of countries by current statistics by years
About & Feedback
Terms
Privacy
FAQ
Support 24/7
Cabinet
Get premium
Donate
The service accepts bank transfer (ACH, Wire) or cards (Visa, MasterCard, etc). Processed by Stripe.
Secured with SSL