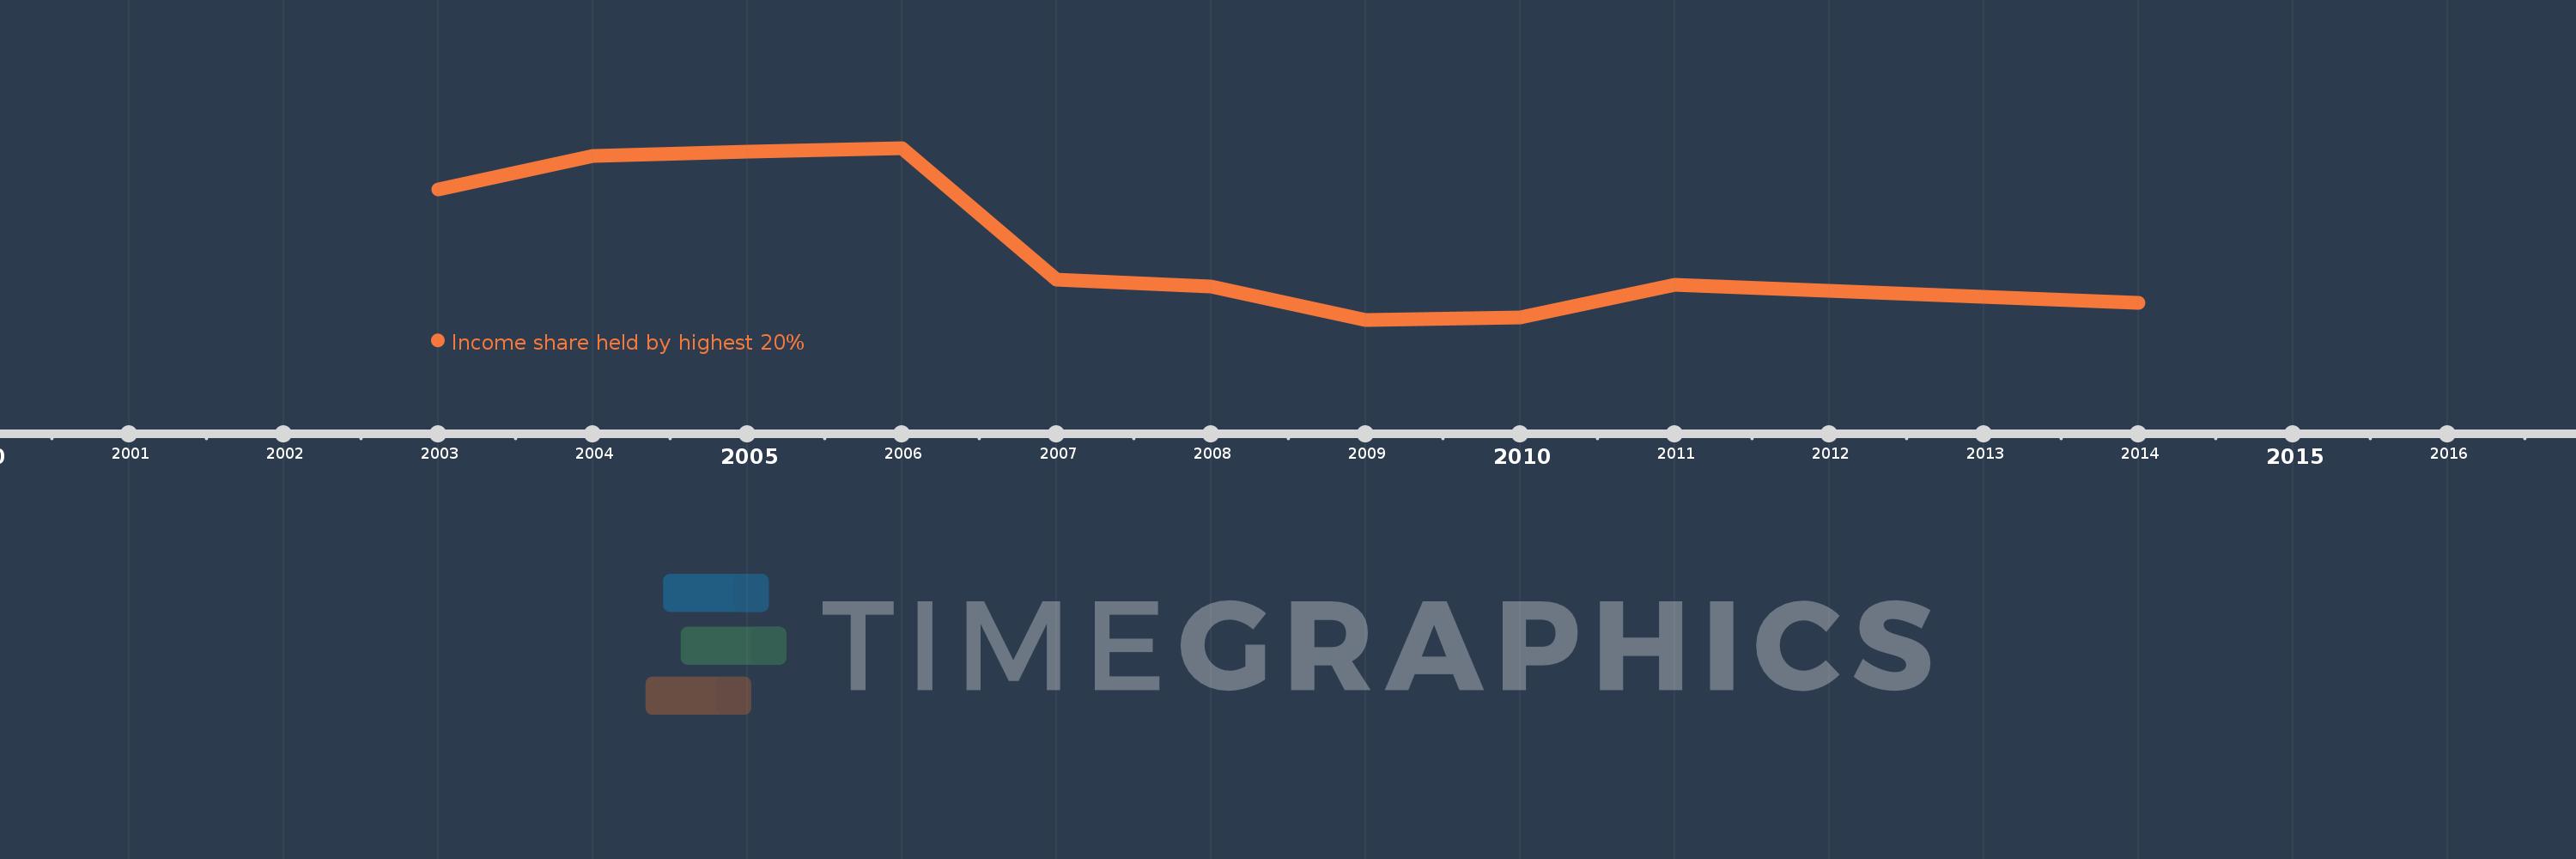
This timeline shows a graph from 2003 to 2014 of Serbia. No data until 2002. Number of actual observations by date: 10.
Source name:
World Development Indicators
Source organization:
World Bank, Development Research Group. Data are based on primary household survey data obtained from government statistical agencies and World Bank country departments. Data for high-income economies are from the Luxembourg Income Study database. For more information and methodology, please see PovcalNet (http://iresearch.worldbank.org/PovcalNet/index.htm).
Categories, topics:
Poverty
Last updated:
apr 23, 2017
Indicators value changes by year
Meaning:
39.075
Minimum:
37.47
jan 1, 2009
Maximum:
41.09
jan 1, 2006
At the date of observation
Value
Absolute change
Change from the previous value
jan 1, 2003
40.22
+40.22
0.0%
jan 1, 2004
40.92
+0.7
1.74%
jan 1, 2005
41.02
+0.1
0.24%
jan 1, 2006
41.09
+0.07
0.17%
jan 1, 2007
38.32
-2.77
-6.74%
jan 1, 2008
38.17
-0.15
-0.39%
jan 1, 2009
37.47
-0.7
-1.83%
jan 1, 2010
37.52
+0.05
0.13%
jan 1, 2011
38.2
+0.68
1.81%
jan 1, 2014
37.82
-0.38
-0.99%
Ranking of countries by current statistics by years