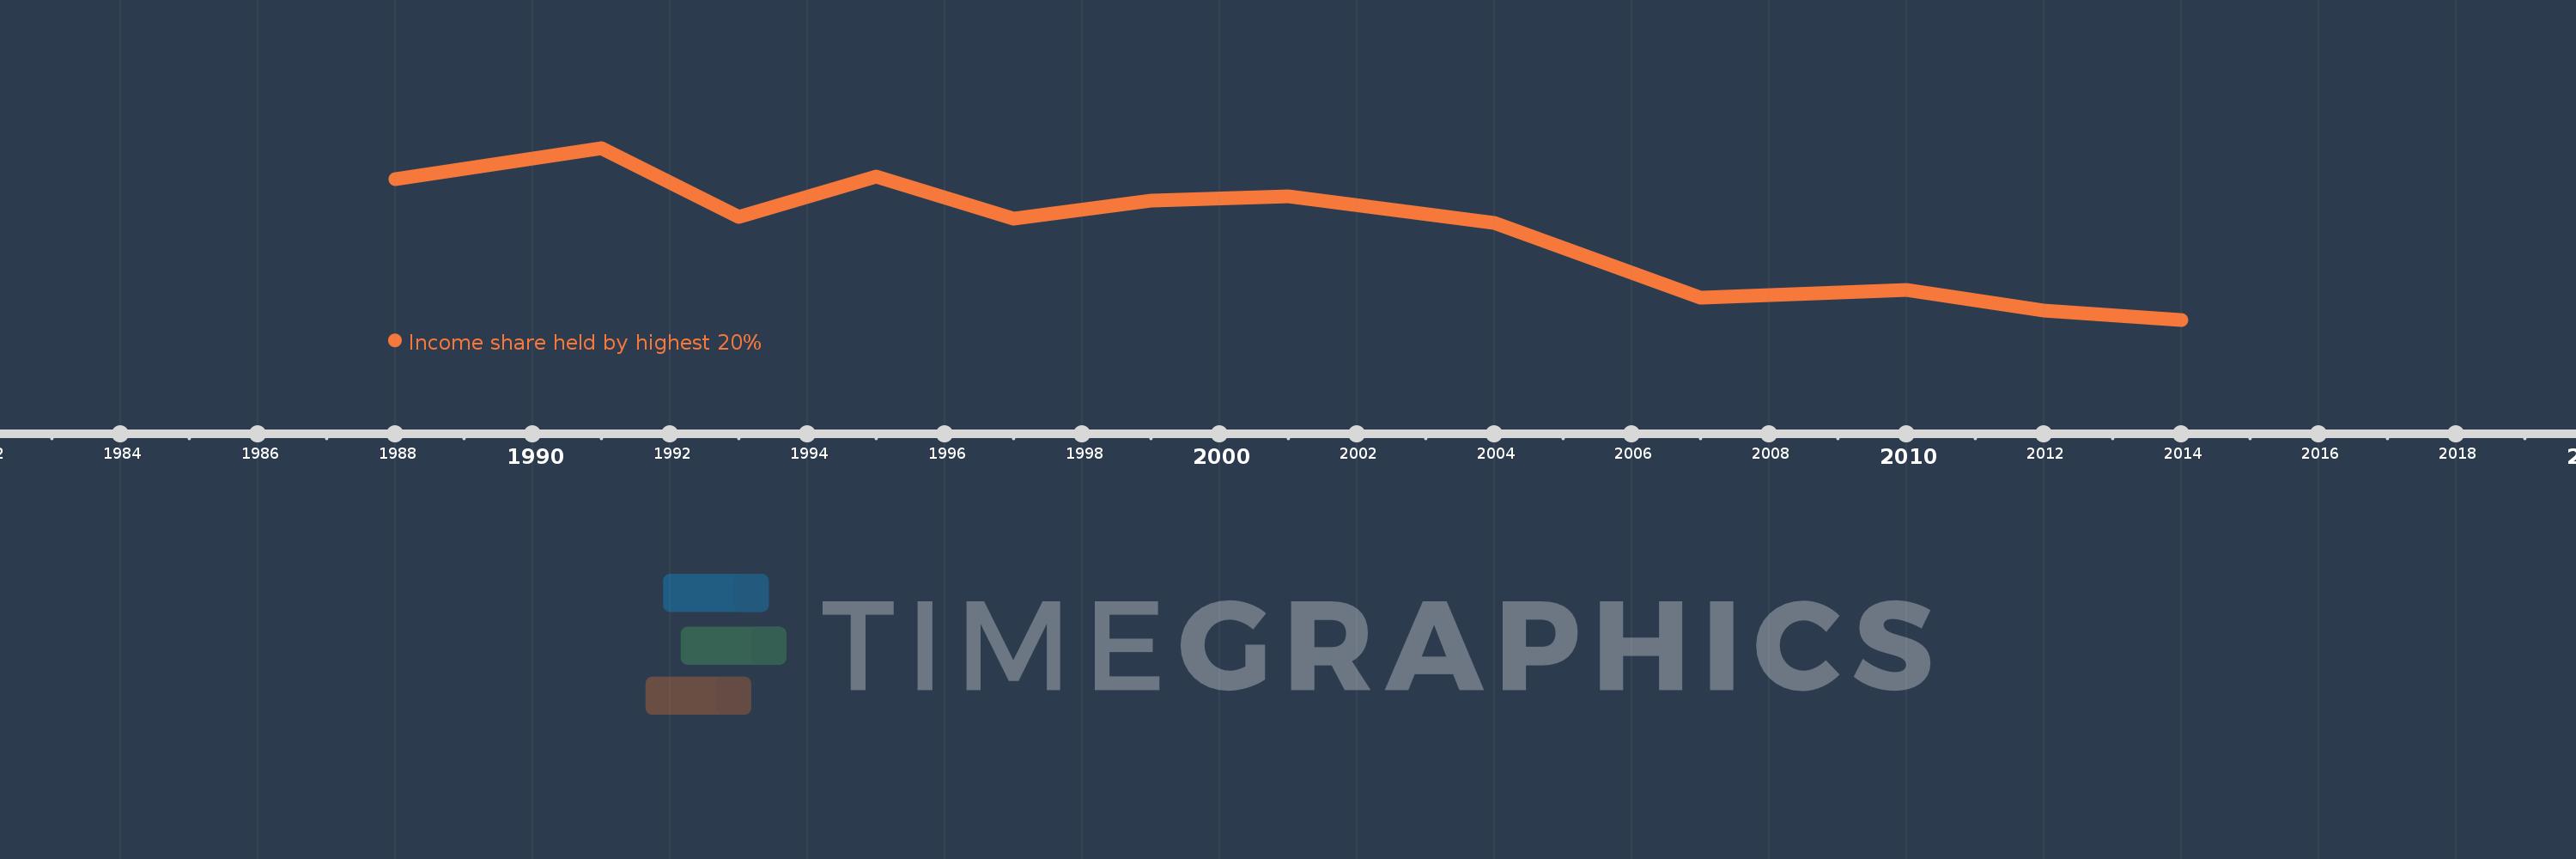
This timeline shows a graph from 1988 to 2014 of Chile. No data until 1987. Number of actual observations by date: 12.
Source name:
World Development Indicators
Source organization:
World Bank, Development Research Group. Data are based on primary household survey data obtained from government statistical agencies and World Bank country departments. Data for high-income economies are from the Luxembourg Income Study database. For more information and methodology, please see PovcalNet (http://iresearch.worldbank.org/PovcalNet/index.htm).
Categories, topics:
Poverty
Last updated:
apr 23, 2017
Indicators value changes by year
Meaning:
59.654
Minimum:
56.69
jan 1, 2014
Maximum:
62.46
jan 1, 1991
At the date of observation
Value
Absolute change
Change from the previous value
jan 1, 1988
61.4
+61.4
0.0%
jan 1, 1991
62.46
+1.06
1.73%
jan 1, 1993
60.14
-2.32
-3.71%
jan 1, 1995
61.5
+1.36
2.26%
jan 1, 1997
60.1
-1.4
-2.28%
jan 1, 1999
60.68
+0.58
0.97%
jan 1, 2001
60.83
+0.15
0.25%
jan 1, 2004
59.95
-0.88
-1.45%
jan 1, 2007
57.43
-2.52
-4.2%
jan 1, 2010
57.68
+0.25
0.44%
jan 1, 2012
56.99
-0.69
-1.2%
jan 1, 2014
56.69
-0.3
-0.53%
Ranking of countries by current statistics by years