33
/
AIzaSyB4mHJ5NPEv-XzF7P6NDYXjlkCWaeKw5bc
November 30, 2025
230406
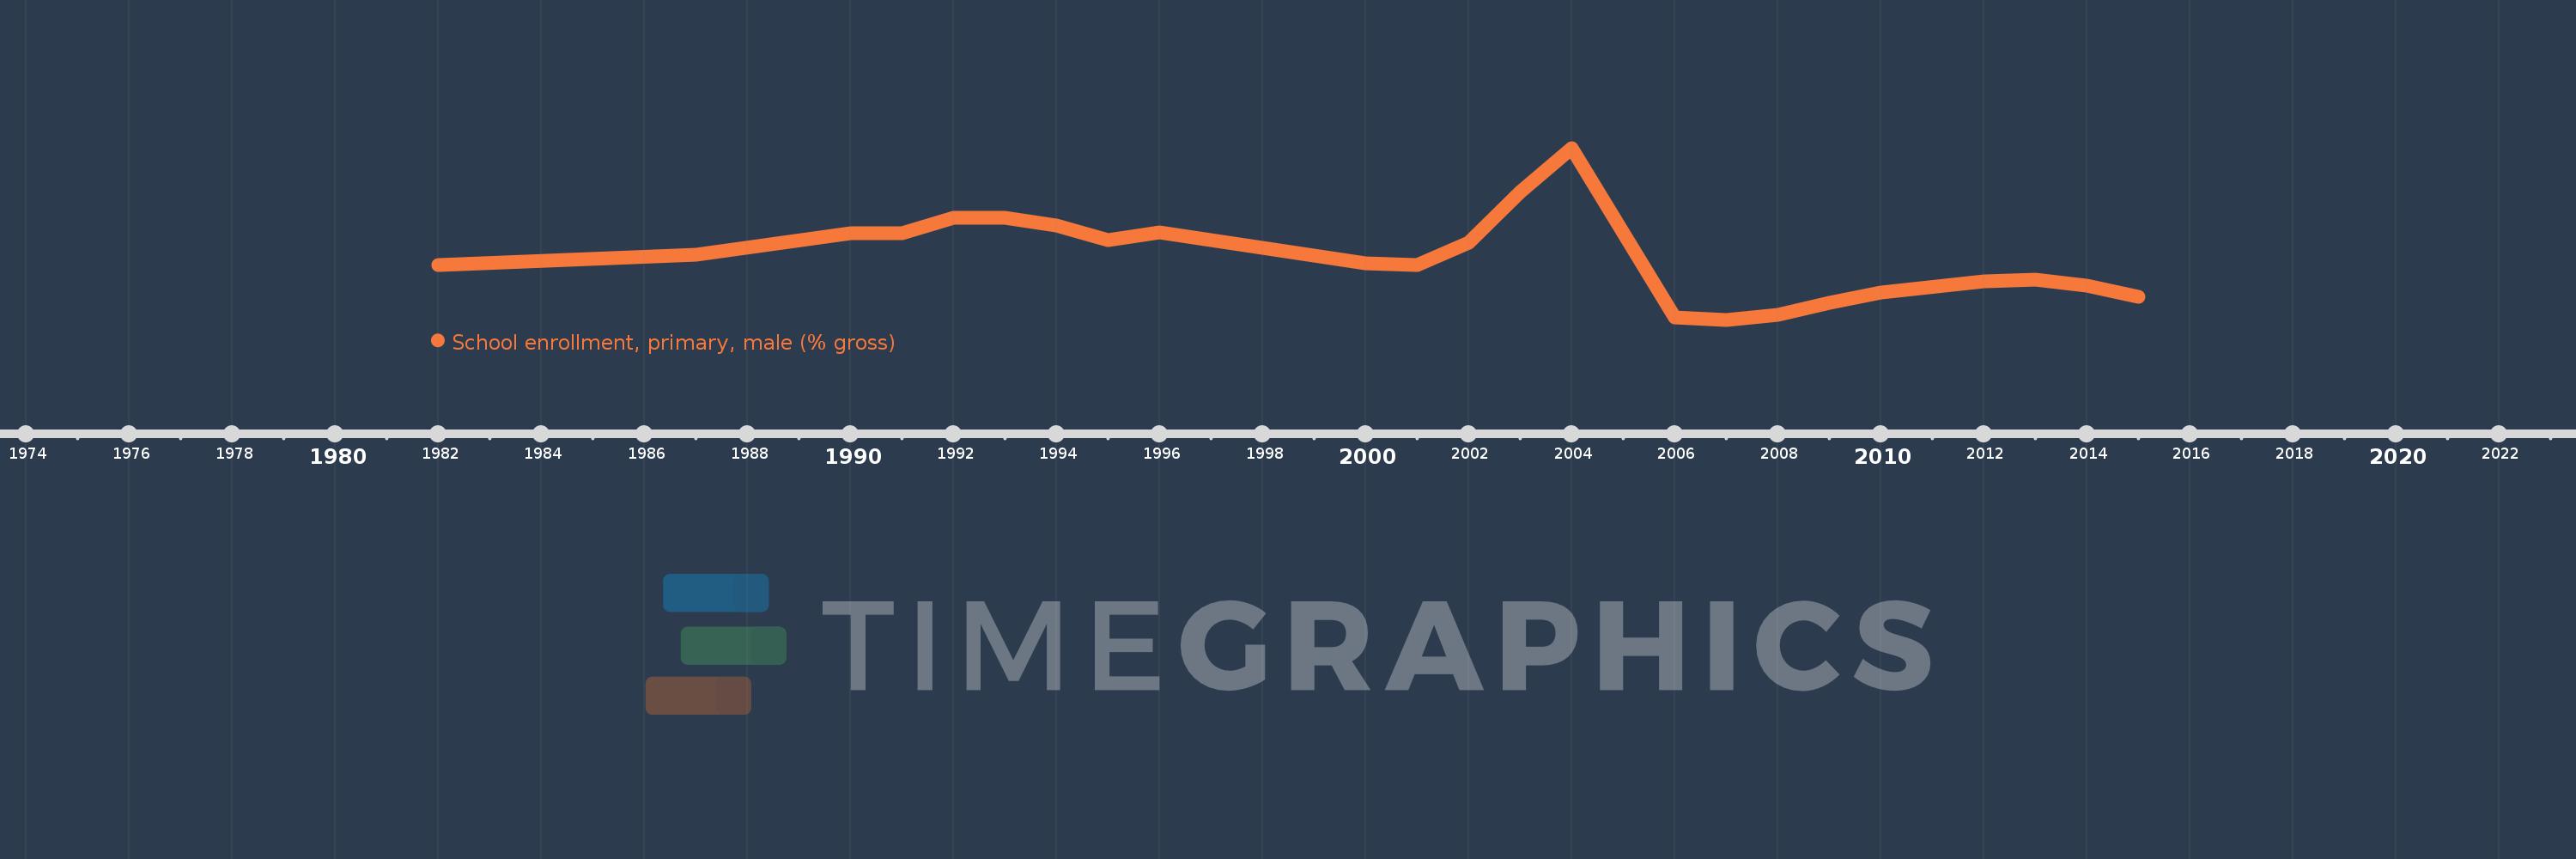
Russian Federation
RUS
true
2
1
School enrollment, primary, male (% gross)
2015,2014,2013,2012,2010,2009,2008,2007,2006,2004,2003,2002,2001,2000,1996,1995,1994,1993,1992,1991,1990,1987,1982