33
/
AIzaSyB4mHJ5NPEv-XzF7P6NDYXjlkCWaeKw5bc
November 30, 2025
122837
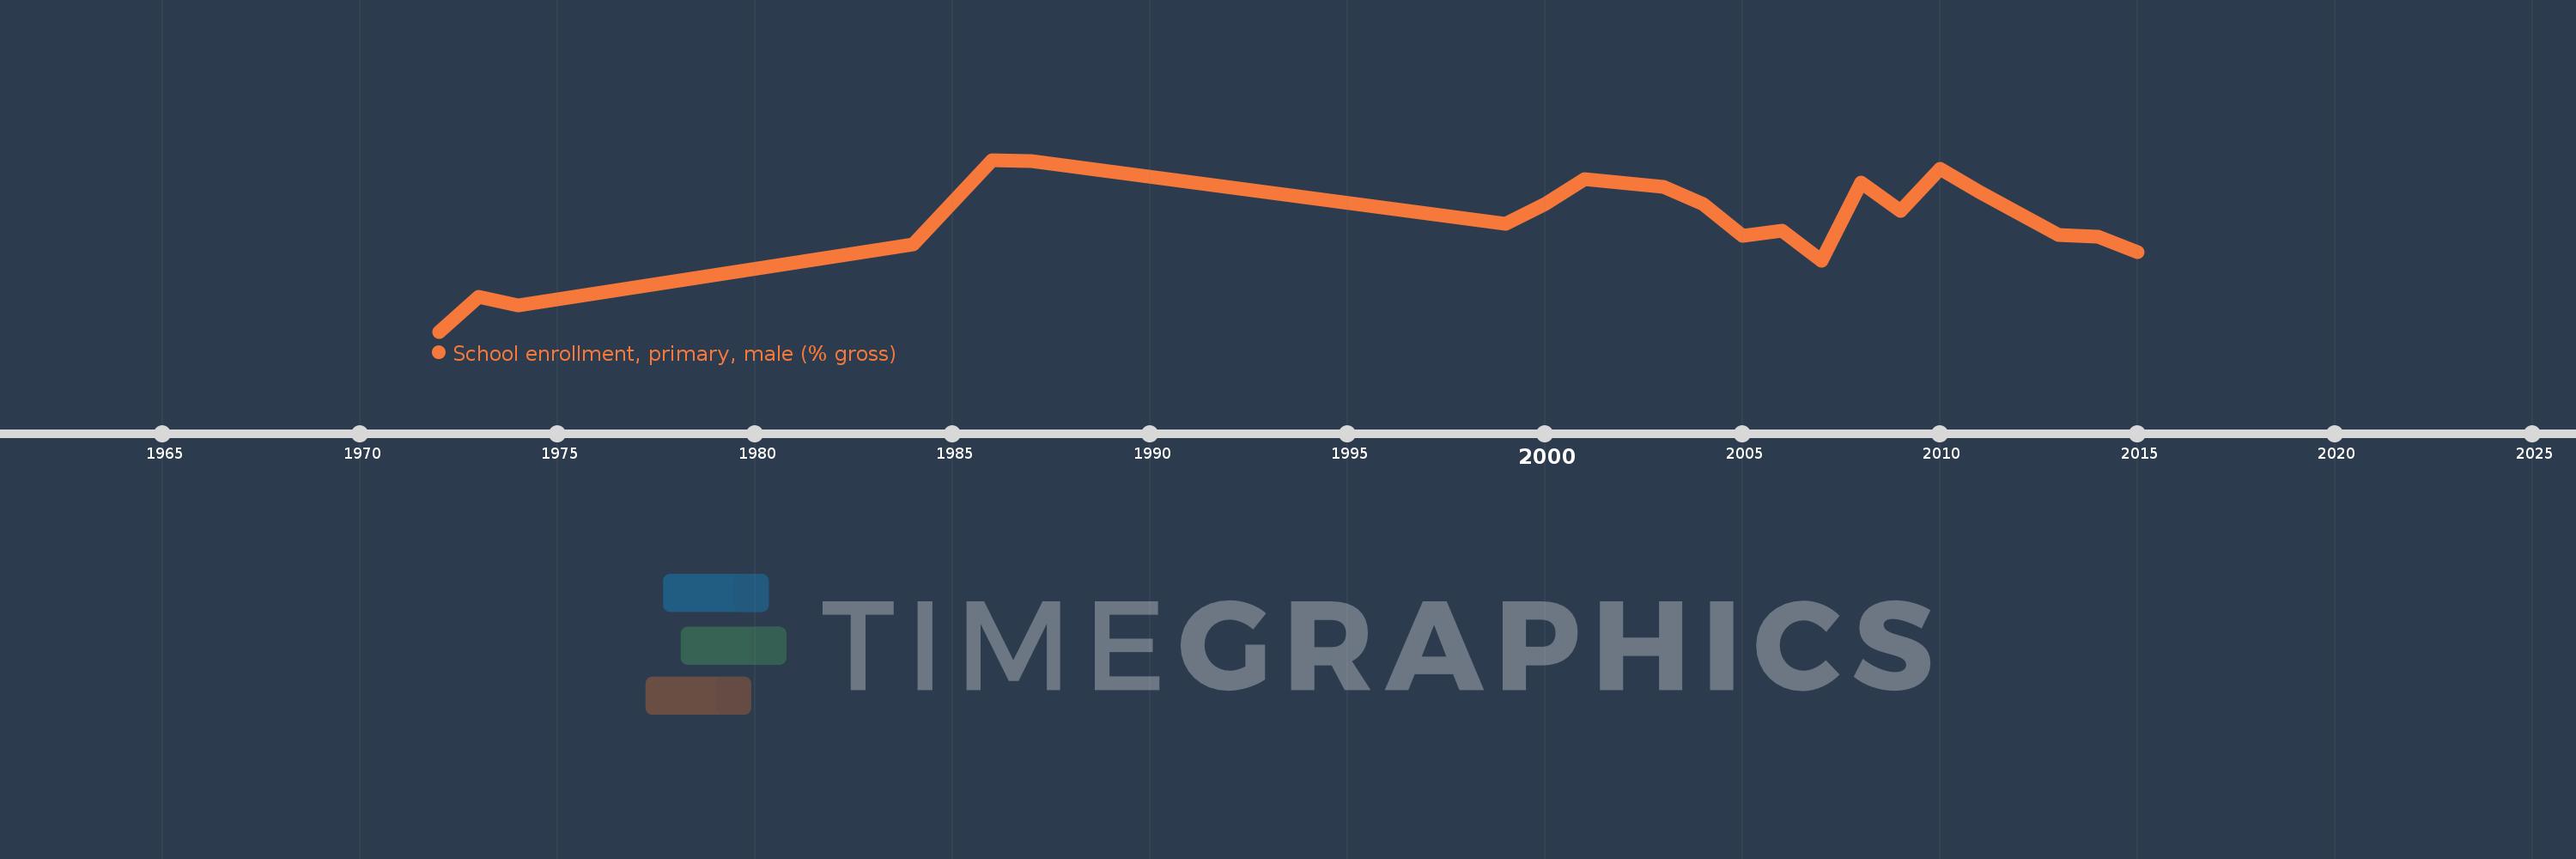
Dominican Republic
DOM
true
2
1
School enrollment, primary, male (% gross)
2015,2014,2013,2012,2011,2010,2009,2008,2007,2006,2005,2004,2003,2001,2000,1999,1987,1986,1984,1974,1973,1972