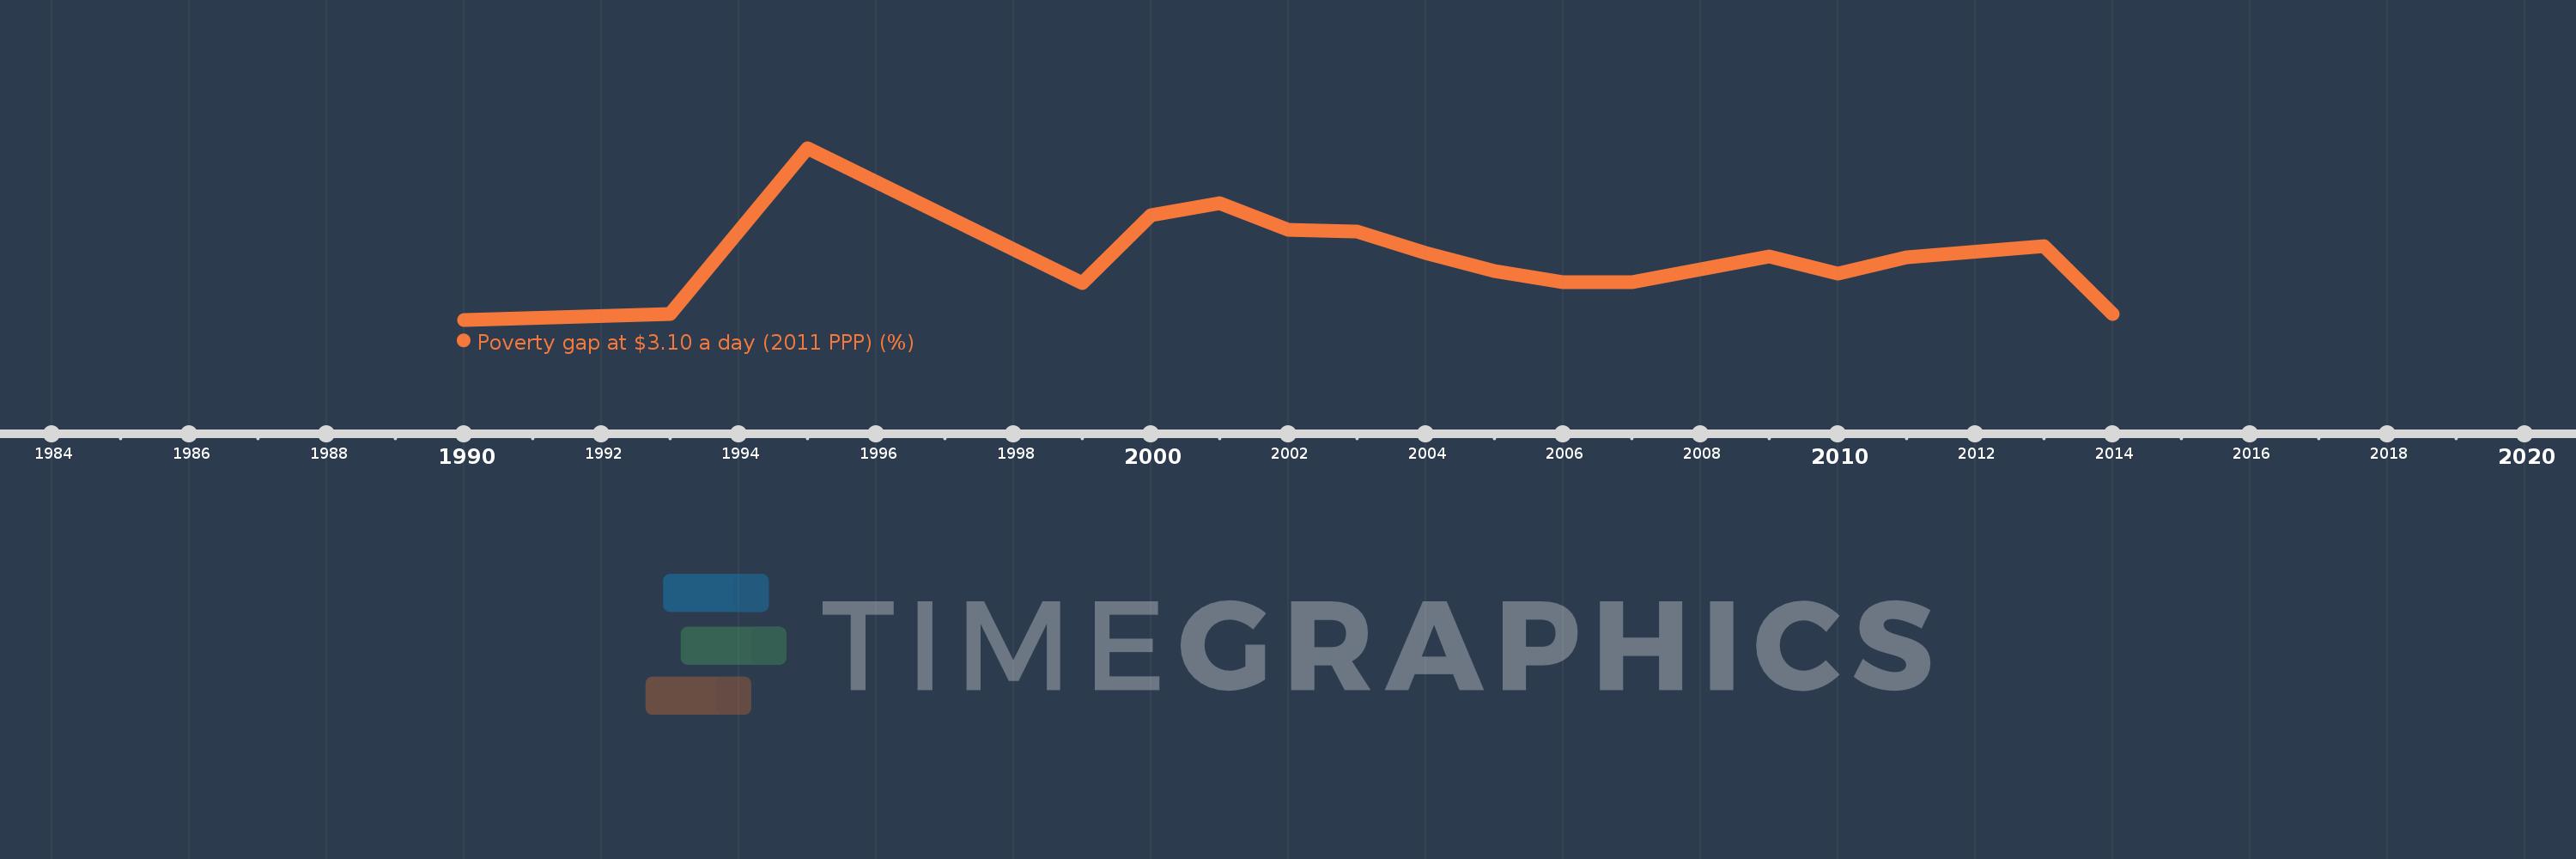
This timeline shows a graph from 1990 to 2014 of Romania. No data until 1989. Number of actual observations by date: 17.
Source name:
World Development Indicators
Source organization:
World Bank, Development Research Group. Data are based on primary household survey data obtained from government statistical agencies and World Bank country departments. Data for high-income economies are from the Luxembourg Income Study database. For more information and methodology, please see PovcalNet (http://iresearch.worldbank.org/PovcalNet/index.htm).
Categories, topics:
Poverty
Last updated:
apr 23, 2017
Indicators value changes by year
Meaning:
4.209
Minimum:
0.35
jan 1, 1990
Maximum:
11.05
jan 1, 1995
At the date of observation
Value
Absolute change
Change from the previous value
jan 1, 1990
0.35
+0.35
0.0%
jan 1, 1993
0.71
+0.36
102.86%
jan 1, 1995
11.05
+10.34
1.46K%
jan 1, 1999
2.64
-8.41
-76.11%
jan 1, 2000
6.86
+4.22
159.85%
jan 1, 2001
7.59
+0.73
10.64%
jan 1, 2002
5.93
-1.66
-21.87%
jan 1, 2003
5.82
-0.11
-1.85%
jan 1, 2004
4.51
-1.31
-22.51%
jan 1, 2005
3.36
-1.15
-25.5%
jan 1, 2006
2.67
-0.69
-20.54%
jan 1, 2007
2.71
+0.04
1.5%
jan 1, 2009
4.29
+1.58
58.3%
jan 1, 2010
3.21
-1.08
-25.17%
jan 1, 2011
4.23
+1.02
31.78%
jan 1, 2013
4.91
+0.68
16.08%
jan 1, 2014
0.72
-4.19
-85.34%
Ranking of countries by current statistics by years