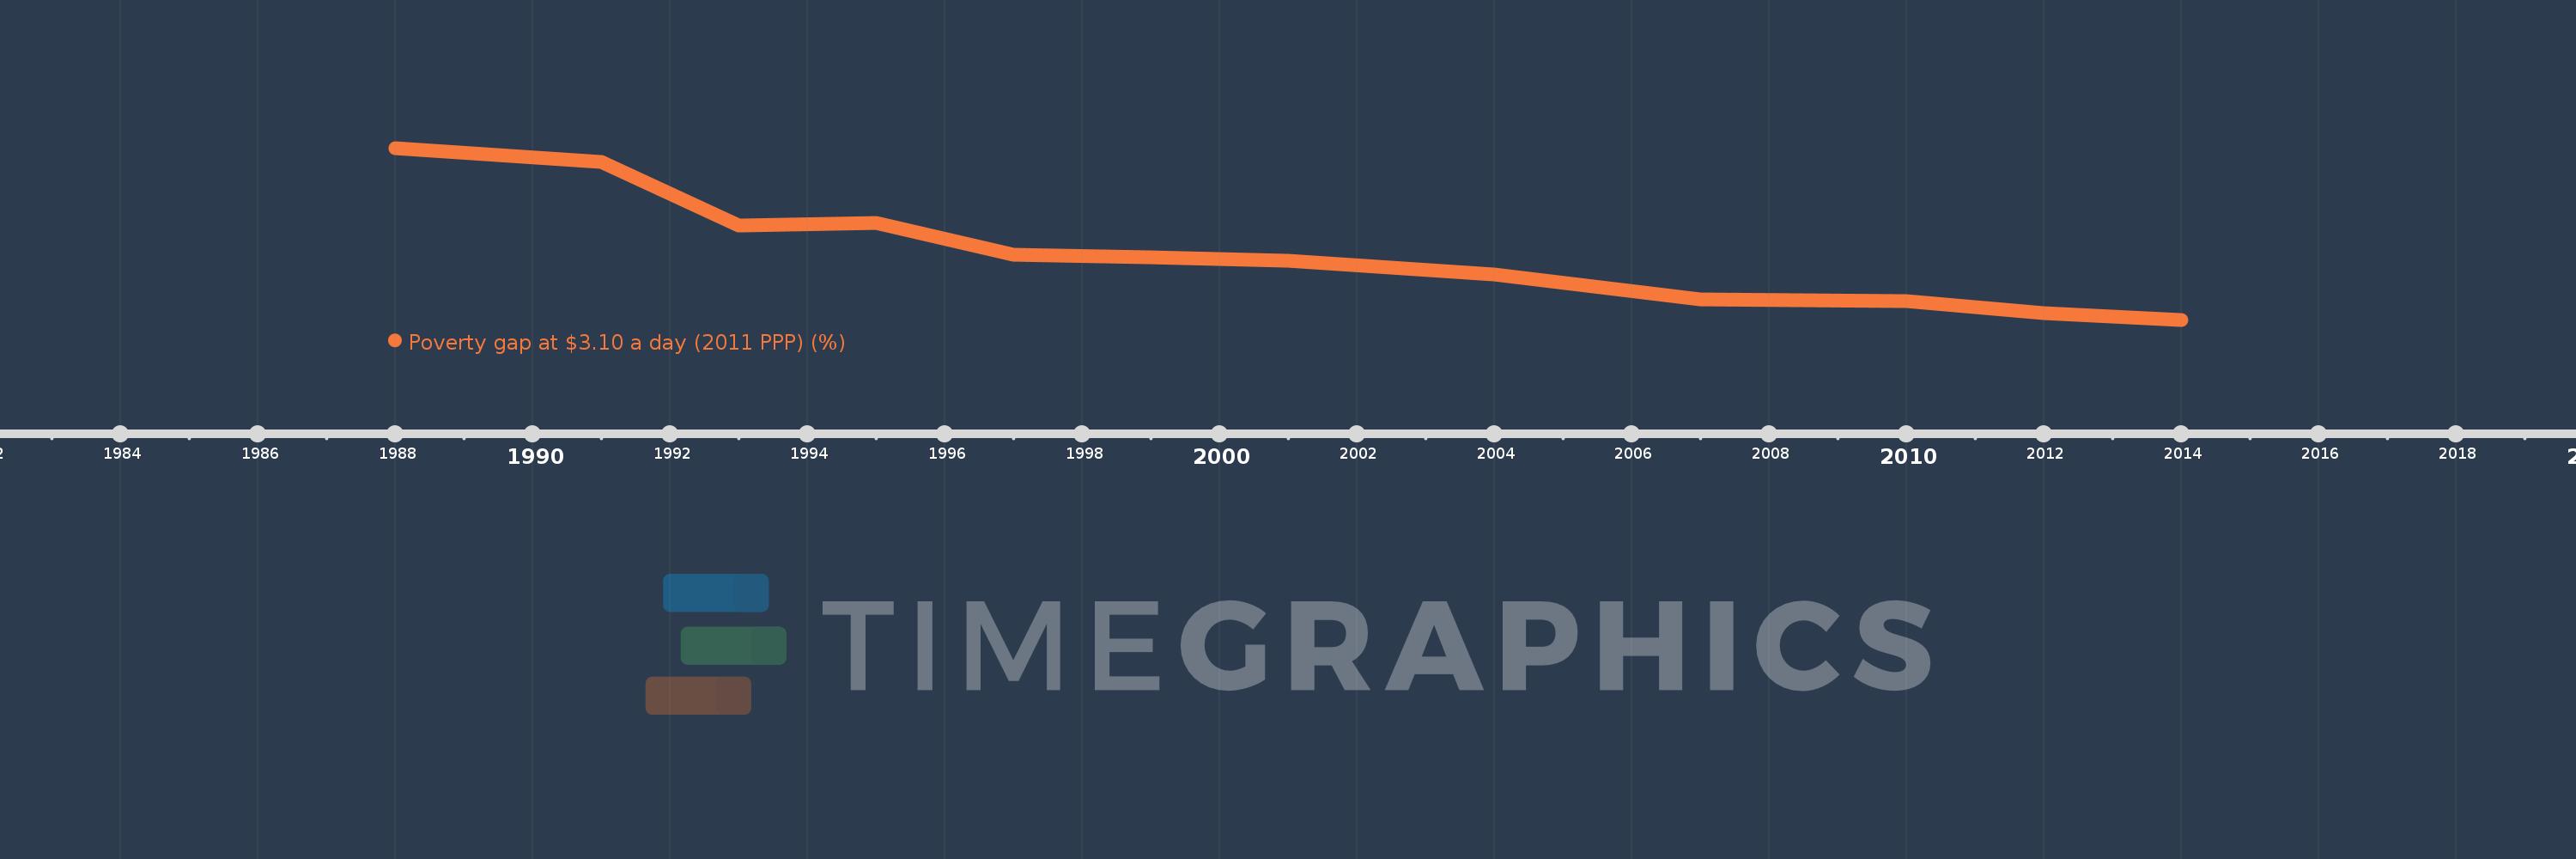
This timeline shows a graph from 1988 to 2014 of Chile. No data until 1987. Number of actual observations by date: 12.
Source name:
World Development Indicators
Source organization:
World Bank, Development Research Group. Data are based on primary household survey data obtained from government statistical agencies and World Bank country departments. Data for high-income economies are from the Luxembourg Income Study database. For more information and methodology, please see PovcalNet (http://iresearch.worldbank.org/PovcalNet/index.htm).
Categories, topics:
Poverty
Last updated:
apr 23, 2017
Indicators value changes by year
Meaning:
3.482
Minimum:
0.82
jan 1, 2014
Maximum:
7.7
jan 1, 1988
At the date of observation
Value
Absolute change
Change from the previous value
jan 1, 1988
7.7
+7.7
0.0%
jan 1, 1991
7.14
-0.56
-7.27%
jan 1, 1993
4.61
-2.53
-35.43%
jan 1, 1995
4.69
+0.08
1.74%
jan 1, 1997
3.42
-1.27
-27.08%
jan 1, 1999
3.32
-0.1
-2.92%
jan 1, 2001
3.17
-0.15
-4.52%
jan 1, 2004
2.65
-0.52
-16.4%
jan 1, 2007
1.64
-1.01
-38.11%
jan 1, 2010
1.55
-0.09
-5.49%
jan 1, 2012
1.07
-0.48
-30.97%
jan 1, 2014
0.82
-0.25
-23.36%
Ranking of countries by current statistics by years