33
/
AIzaSyB4mHJ5NPEv-XzF7P6NDYXjlkCWaeKw5bc
November 30, 2025
227279
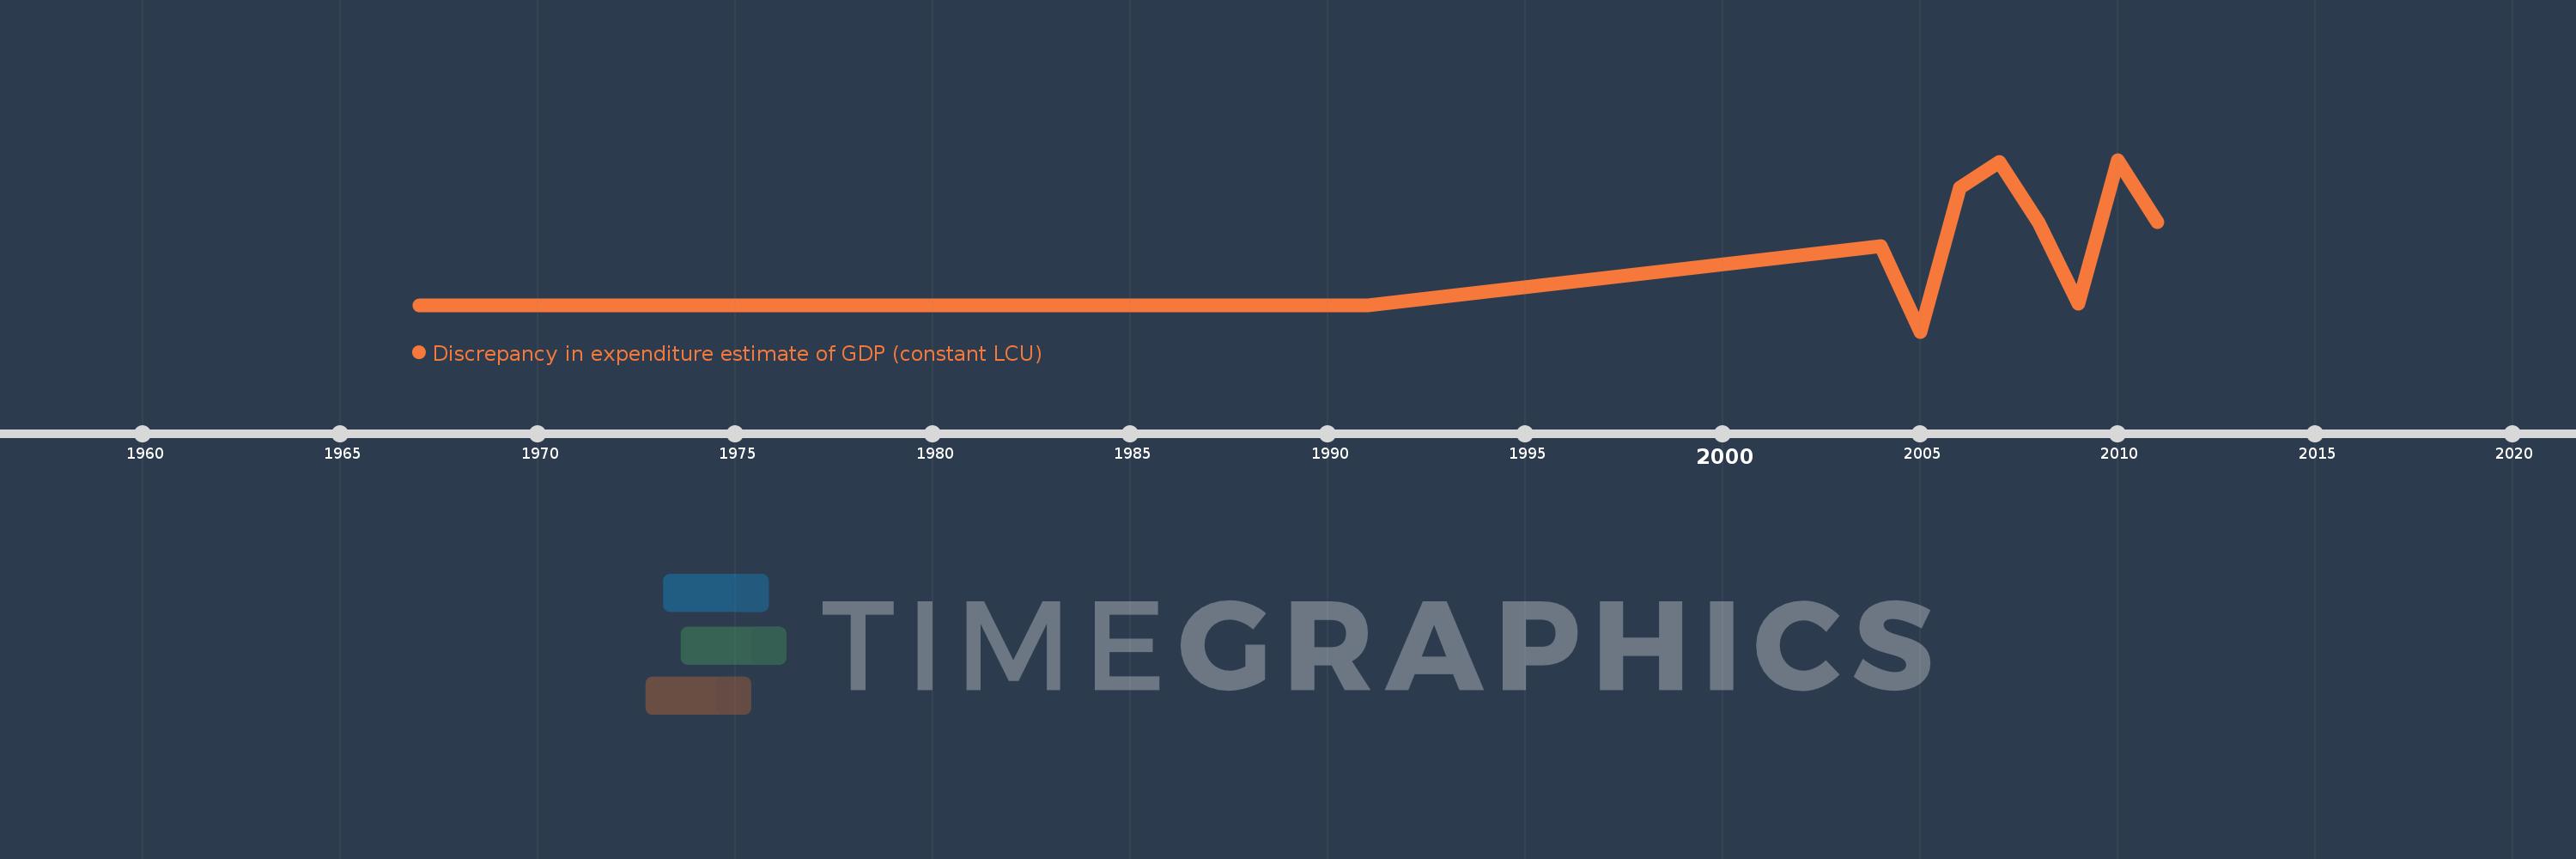
Qatar
QAT
true
2
1
Discrepancy in expenditure estimate of GDP (constant LCU)
2011,2010,2009,2008,2007,2006,2005,2004,1991,1990,1989,1988,1987,1986,1985,1984,1983,1982,1981,1980,1979,1978,1977,1976,1975,1974,1973,1972,1971,1970,1969,1968,1967